The candlestick course · lesson three of six · Zonetta Trading
The six formations worth keeping
A hundred candlestick patterns have names. Six of them earn the space in your head. This lesson is those six, and the exact geometry that makes each one valid.
Written lesson · about sixteen minutes · free, and it asks for nothing
01 / The claim
A hundred patterns, six kept
Open any trading book and somebody will offer to teach you a hundred candlestick patterns. The Abandoned Baby. The Three Line Strike. The Concealing Baby Swallow — that is a real name, and somebody drew it on purpose.
You do not need a hundred. The method this course is built on keeps six: three bullish and three bearish, chosen because they are easy to recognise on a live chart and easy to write a rule around. This lesson is all six, with the exact geometry that makes each one valid — including the one ratio the last pair turns on.
Everything else on that wall is decoration. It is not that the other ninety-four shapes are invented. It is that nobody recognises ninety-four things at speed, on a chart that is still moving, and a shape you cannot recognise at speed is not a shape you can use.
Decision, indecision, decision. Three brushstrokes, one signal. That formula has not changed in three centuries. The rest of this lesson puts names on it.
02 / The map
Three pairs, three mirrors
Three bullish formations mark potential bottoms. Three bearish formations mark potential tops. They are the same three shapes seen from the other end, which is why six names is really three ideas.
- One · bullish engulfing
- One bullish candle that swallows the previous bearish candle whole — or several of them. A potential bottom.
- Two · morning star
- A bearish candle, a candle of doubt sitting below it, then a bullish candle. A potential bottom.
- Three · tweezer bottom
- Two or more candles that drive long, equal wicks into the same floor. A potential bottom.
- Four · bearish engulfing
- One bearish candle that swallows the previous bullish candle whole — or several. A potential top.
- Five · evening star
- A bullish candle, a candle of doubt sitting above it, then a bearish candle. A potential top.
- Six · tweezer top
- Two or more candles that drive long, equal wicks into the same ceiling. A potential top.
Every one of them is assembled from the alphabet the first two lessons handed you: a decision candle, an indecision candle, and the order they arrive in. Nothing new is being introduced here. The shapes you already know are being named and given rules.
Read the list once and then stop trying to memorise it. Nobody recalls six names from a list. What sticks is the story each one tells, and the next four sections are those stories.
03 / The stars
Fear, doubt, conviction — and the mirror
Formation one is the Morning Star: a bullish formation marking a potential bottom and a potential reversal. Read it candle by candle.
A strong bearish decision candle. Sellers are in control. Then a small indecision candle sitting below it — the sell-off stalls, and doubt prints. Then a strong bullish decision candle: buyers take the window.
Fear. Doubt. Conviction.
The name is literal. The morning star is the last star still visible before sunrise, and that is what the middle candle is: the darkest part of the move, printed just before a market turns — when it turns.
Diagram · the morning star, candle by candle
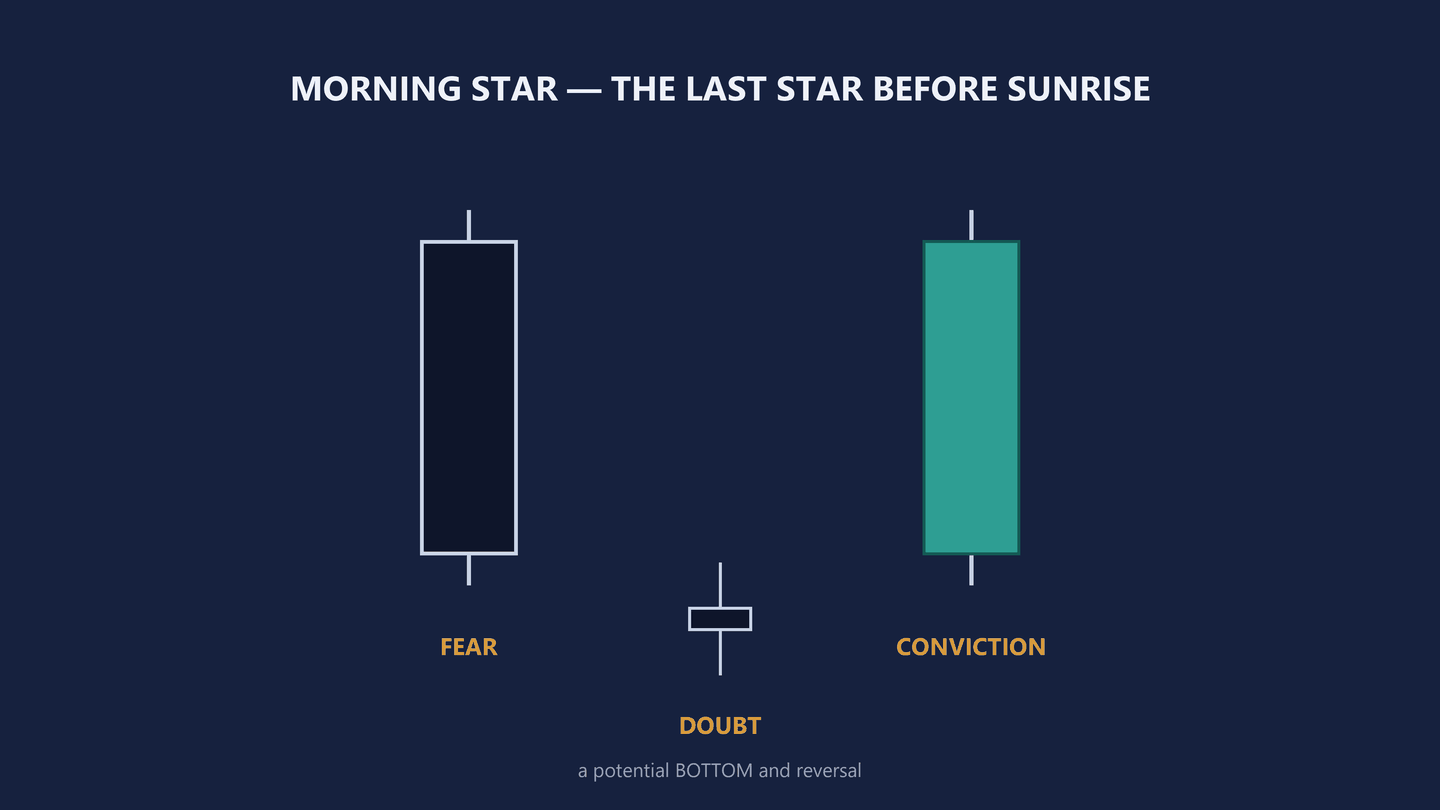
Diagram only · no instrument, no price, no outcome claimed
Now the part that separates people who learned the pattern from a book from people who find it on a live chart. Morning stars come in many shapes, and they can be built from more than three candles.
The textbook version puts one clean doji in the middle. The real chart gives you two dojis, a spinning top and a hammer scattered along the bottom before the bullish candle fires. Same story — fear, doubt, conviction — just messier.
Train your eye on the realistic version. The textbook version is the diagram, not the chart, and a reader who is matching a picture instead of a story will look straight past the real thing.
Diagram · textbook versus live chart
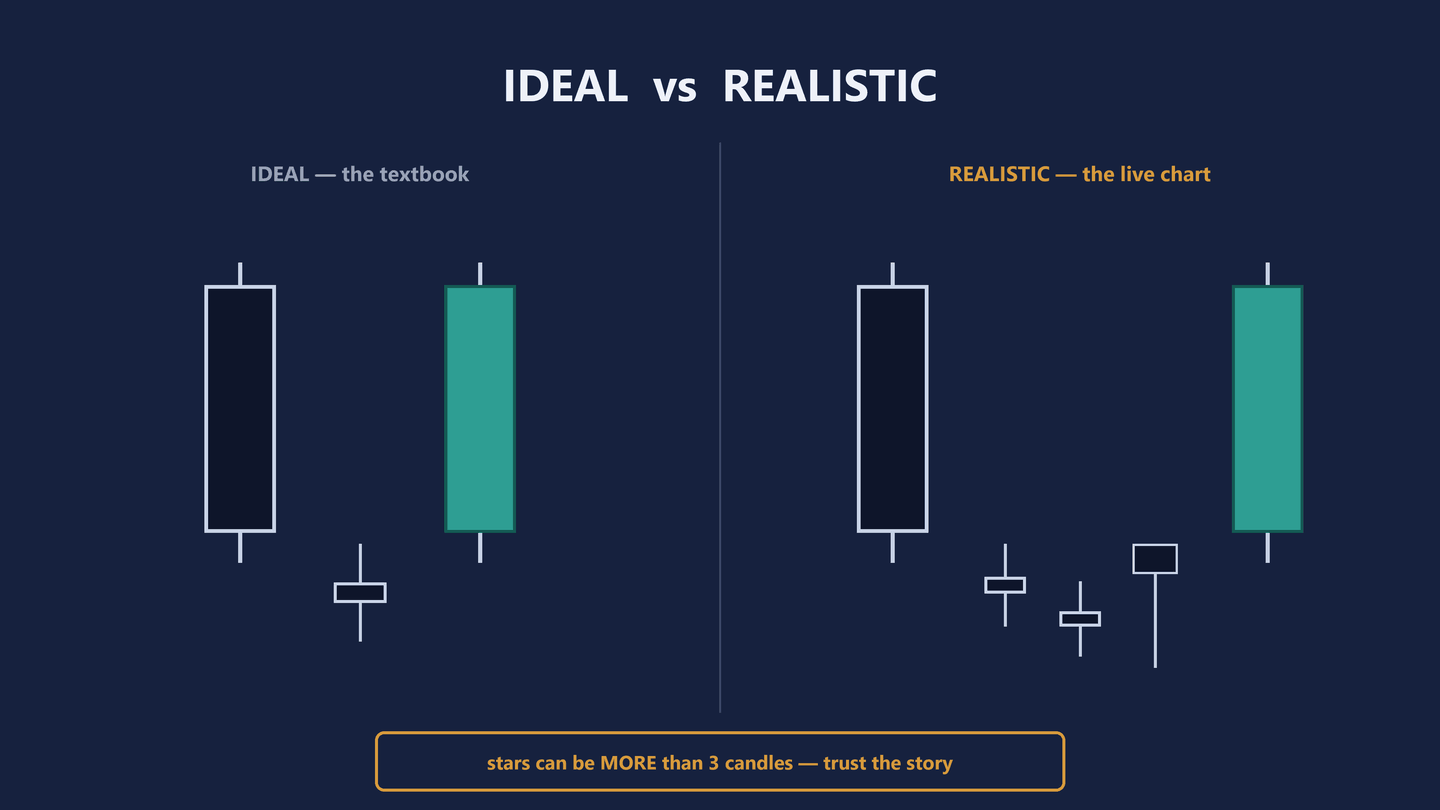
Diagram only · no instrument, no price, no outcome claimed
The evening star
Flip the sunrise and you have formation two: the Evening Star, a bearish formation marking a potential top.
A strong bullish candle — greed. An indecision candle sitting above it — the rally hesitates. A strong bearish candle — sellers close the door. Greed, doubt, rejection, and the same realism rule applies: evening stars come in many shapes and can run to more than three candles.
When that sequence prints at the top of a rally, buyers have handed back the level they just took. That is what happened. What happens next is still open, and the shape does not decide it.
Diagram · the evening star, mirrored
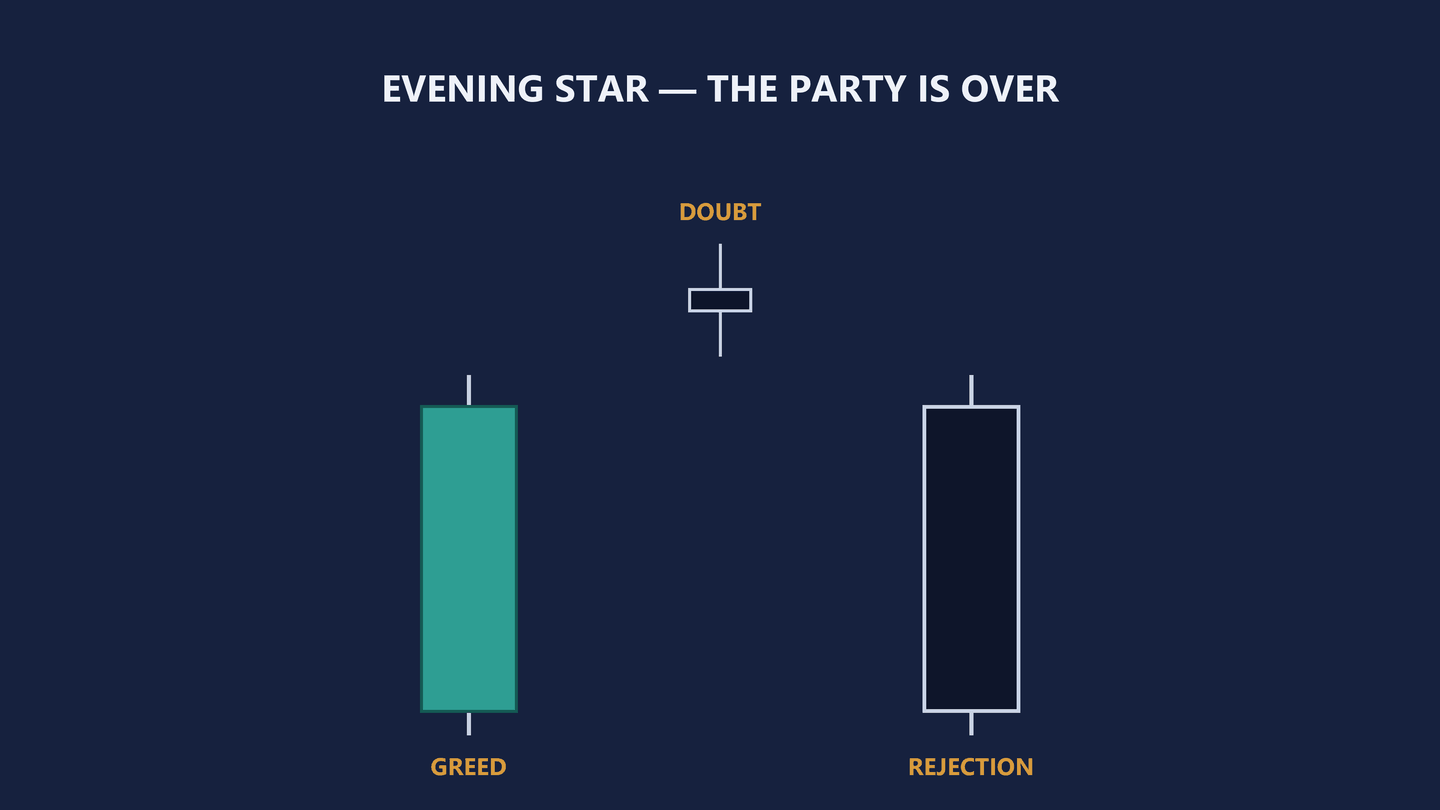
Diagram only · no instrument, no price, no outcome claimed
04 / Checkpoint
Name these three
Look at the plate first. Cover the readings underneath it and name each group before you read the answer.
Diagram · checkpoint, the two stars
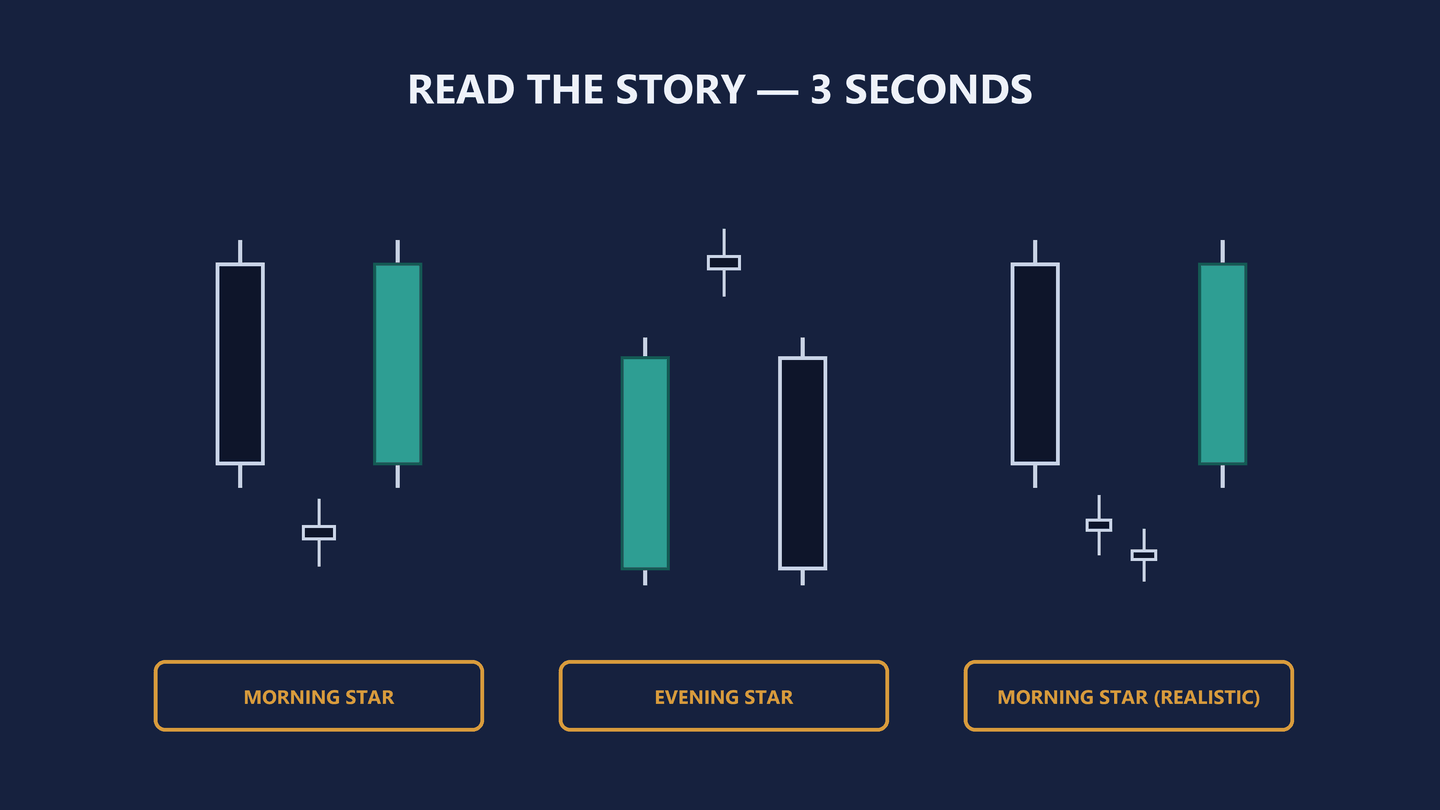
Diagram only · no instrument, no price, no outcome claimed
- Big bearish candle, doji below it, big bullish candle
- Morning star. A potential bottom. Fear, doubt, conviction, in that order.
- Big bullish candle, spinning top above it, big bearish candle
- Evening star. A potential top. Greed, doubt, rejection.
- Two dojis and a hammer in the middle instead of one clean star
- Still a morning star — the realistic version. You are matching the story, not the picture.
That third reading is the whole point of the checkpoint. Anyone can match the textbook diagram. The skill is recognising the story when the market prints it badly — and the market is under no obligation to print it any other way.
05 / The engulfings
One decision erases another
Formations three and four skip the pause entirely. There is no doubt candle in the middle. The market goes straight from one decision to a bigger one in the opposite direction.
The bullish engulfing candle
After a down-swing, a bullish candle completely engulfs the previous bearish candle — or candles, plural. The rule is not a feeling about size. It is two price comparisons.
- Opening price
- Equal to or lower than the close — or the low — of the previous bearish candle.
- Closing price
- Higher than the opening of the previous bearish candle, or candles. Its opening, not its close — that is the comparison people get wrong.
In plain language: buyers did not just win their own window. They erased the sellers’ entire previous move, and then some.
Diagram · the bullish engulfing, with its two rules marked
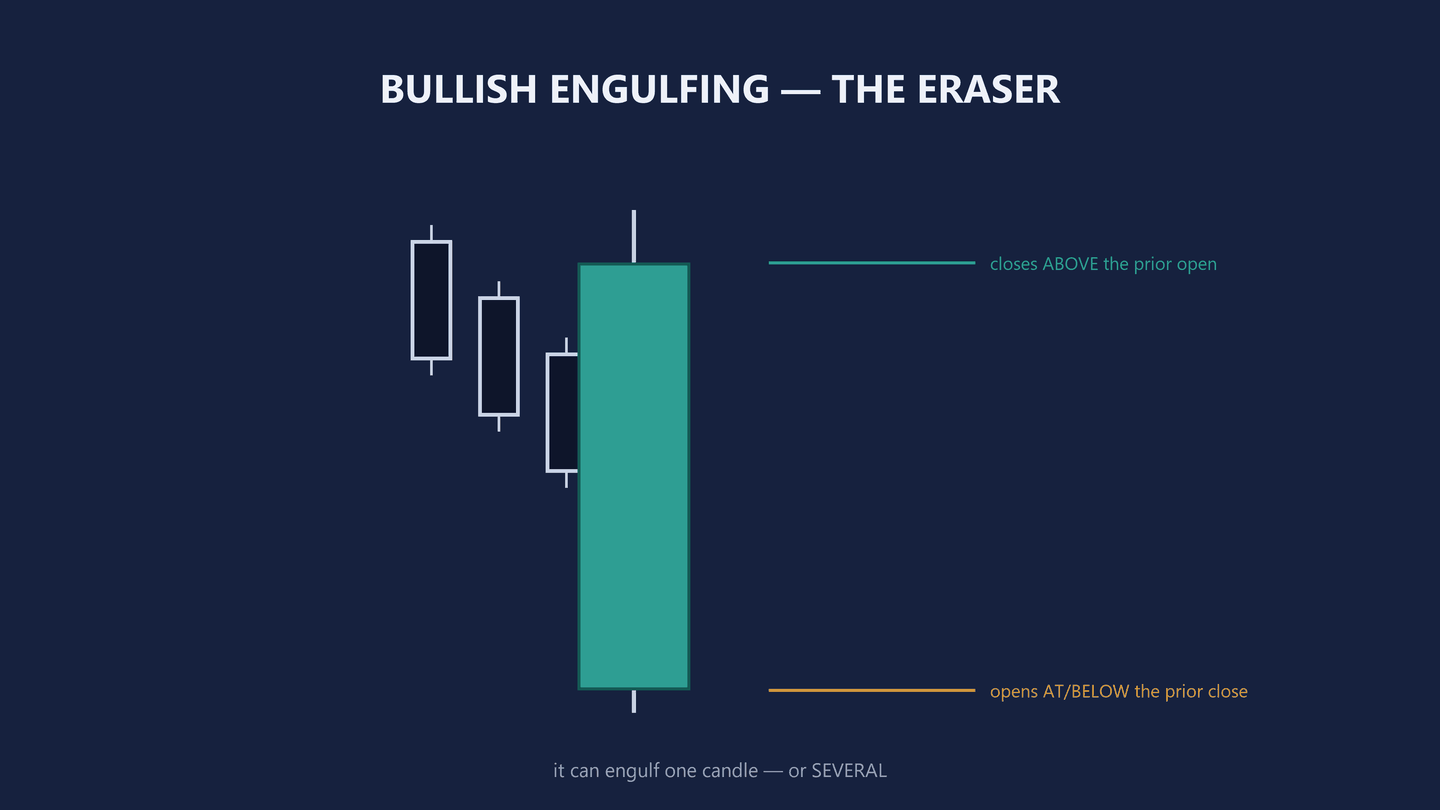
Diagram only · no instrument, no price, no outcome claimed
The bearish engulfing candle
The mirror. After an up-swing, a bearish candle that opens at or above the close of the previous bullish candle, and closes below its opening.
- Opening price
- Equal to or higher than the close of the previous bullish candle.
- Closing price
- Lower than the opening of the previous bullish candle, or candles. Again the opening, not the close.
Notice the plural again, on both sides. A true engulfing can swallow two, three, four previous candles. The more it swallows, the louder the statement it is making about who was in the market during those windows and who is in it now.
Diagram · the bearish engulfing, mirrored
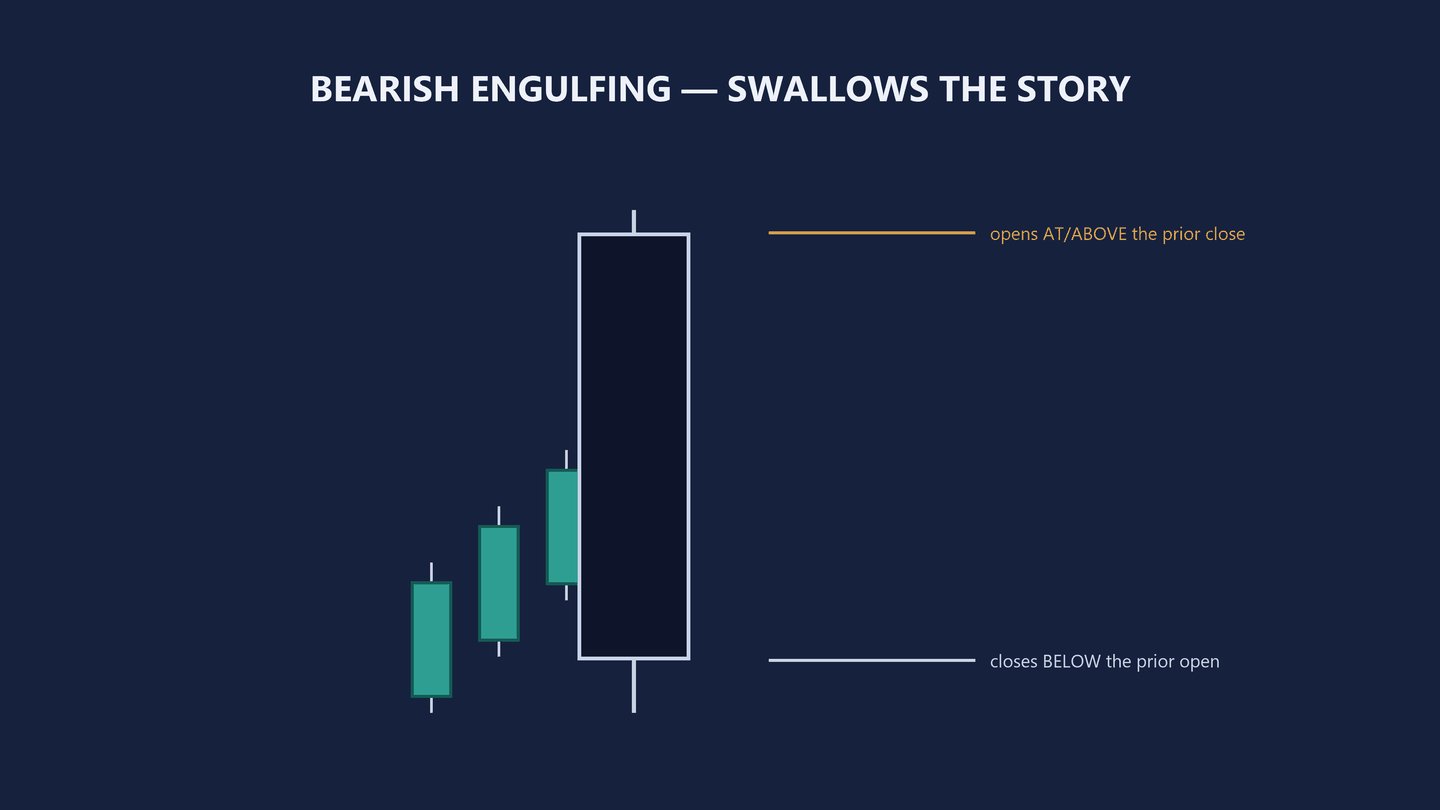
Diagram only · no instrument, no price, no outcome claimed
06 / The tweezers
Two prongs into the same price
Wick sixty percent or more
Body forty percent or less
The last pair has the strangest name and the most precise rule in this lesson. Tweezers.
Picture a blacksmith’s tongs: two prongs, exactly the same length, gripping the same point. Now put that on a chart.
The tweezer top
A bearish formation marking a potential top. Two or more candles — the bodies can be bullish or bearish, it makes no difference — but at least two of them print long, equal wicks on the north side. Equal within a few points or ticks, depending on the instrument. Twice price spiked into the same ceiling, and twice it was pushed back from the same price.
And here is the ratio the whole formation turns on. For a tweezer to count, the wick has to be at least 60 percent of the total candle, and the body no more than 40. Wick sixty, body forty. That is what separates a genuine double rejection from two ordinary candles that happen to line up near each other.
The tweezer bottom
The bullish mirror. Two or more candles with long, equal wicks on the south side, equal within a few points or ticks, wick at least sixty percent, body at most forty. Twice sellers drove price into the same floor. Twice buyers bought it back, to the tick. That floor is being defended, and the two wicks are the receipt.
Diagram · the tweezer geometry, drawn once
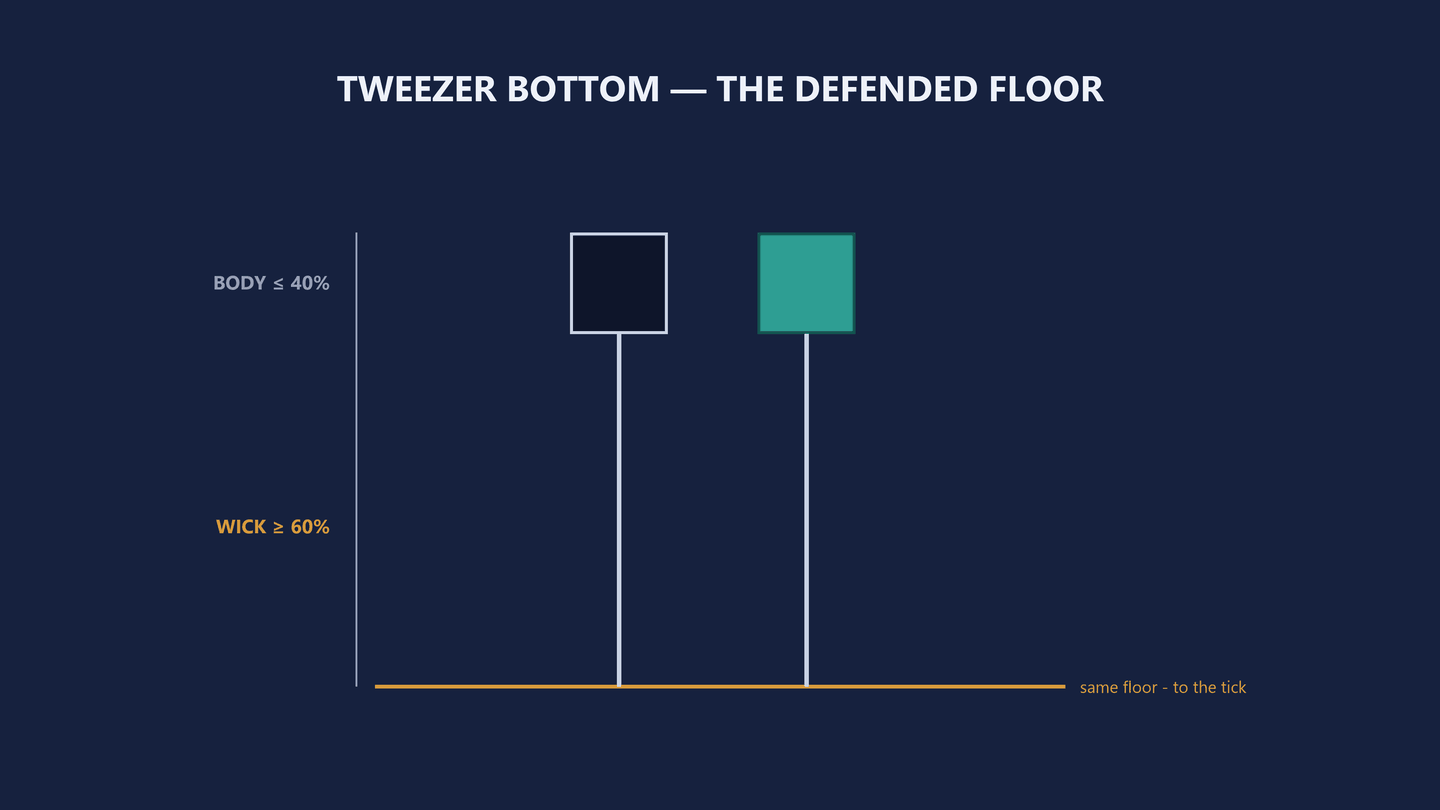
Diagram only · no instrument, no price, no outcome claimed
That is six. Three bullish, three bearish, three mirrors, and for every one of them a comparison you can make with your eyes on a chart rather than a feeling you have to talk yourself into.
07 / The shortlist
Why these six and not the other ninety-four
Three reasons, and none of them is about how much a shape is worth.
First, they mark potential turning points rather than continuations. A shape that says the market may be turning here gives you something to act against. A shape that says the market is still doing what it was already doing gives you nothing you did not have a minute ago.
Second, direction. These are read with the trend, not against it. A morning star inside a market that has been making lower highs for a week is the right shape standing in a hostile place, and the shape does not know that. You do.
Third, and this is the one that actually decides it: every one of the six defines a level. The low of the star. The open of the engulfed candle. The wick the two tweezers share. A formation that hands you a level hands you somewhere to put a protective stop, and a stop you can point at on the chart is the difference between a trade and a guess.
That is where this lesson stops, deliberately. Knowing the six shapes is half the job. Where does the entry go. Where exactly does the stop go, in points or ticks. When is the honest answer to leave it alone. That is a protocol, and it is the fourth lesson.
A formation is not a trade. It is a shape that says one side just gave ground at a price you can name. What you do with that — or whether you do anything at all — is a separate decision, made with rules written before the chart got interesting.
08 / Practice
Three more, at full speed
Same drill as the checkpoint, with all six formations in play this time. Cover the readings and name each group first.
Diagram · final check, all six in play
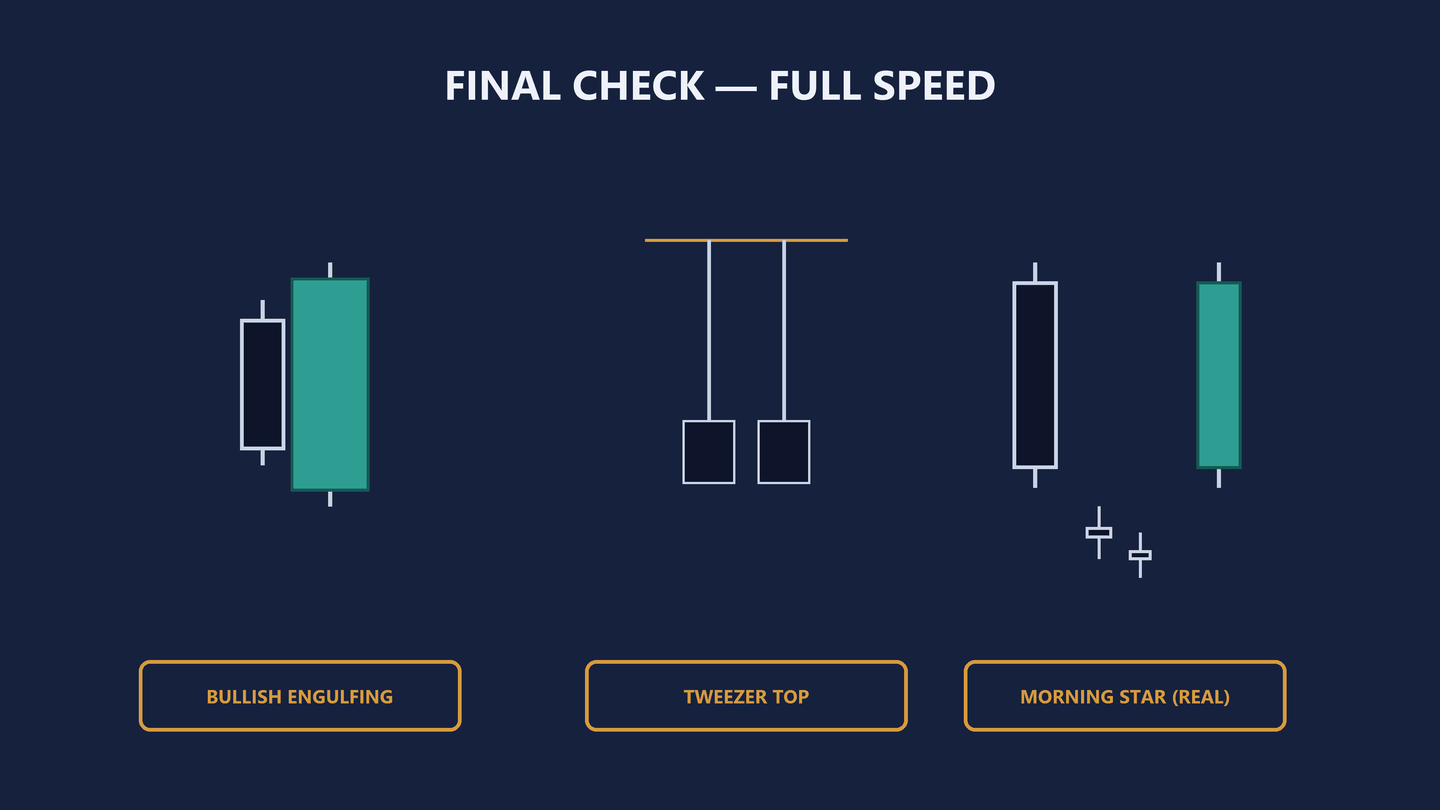
Diagram only · no instrument, no price, no outcome claimed
- A large bullish candle that opens below and closes above the whole of the previous bearish candle
- Bullish engulfing. Check both ends before you call it: the open at or under the previous close, the close above the previous open.
- A rally, then two candles spiking the same ceiling with long wicks on top
- Tweezer top — provided each of those wicks is at least sixty percent of its own candle. If the bodies are the bigger half, it is two ordinary candles that happen to line up.
- A bearish candle, a messy cluster of small bodies below it, then a strong bullish candle
- Morning star, realistic version. More than three candles is normal, not disqualifying.
Three for three means you are reading formations rather than remembering pictures, and those are different skills.
Now do it somewhere it counts for nothing. Open any instrument on any period, scroll back a few hundred candles, and mark every one of the six you can find. You will call some of them wrong. Being wrong on a chart nobody is trading is exactly how the recognition installs, and it is the only part of this lesson that does.
09 / Recap
What to take away, and what comes next
- Engulfing
- One decision erases another. Opens beyond the previous close, closes beyond the previous open, and it can swallow more than one candle.
- Stars
- Fear, doubt, conviction at a bottom. Greed, doubt, rejection at a top. They run to more than three candles on a real chart, so match the story rather than the picture.
- Tweezers
- Equal wicks driven into the same price twice, within a few points or ticks. Wick at least sixty percent of the candle, body at most forty.
- Direction
- All six are read with the trend, and every turn they mark is a potential one. None of them confirms anything.
- The limit
- A formation is not a trade. A perfect shape with no rule for entry, stop and target is still just a shape on a screen.
If you can name all six from a silhouette, without stopping to check which end the small candle sits at, you are ready for the last lesson. That one is the protocol: where the entry sits, where the protective stop sits, where the target sits, and when the honest answer is to leave the trade alone. It is the lesson that turns six shapes into something you can follow.
Six lessons are written, and this is the third. Both of the lessons this page used to describe as planned now exist: ten drills to prove you can see the shapes without being told where they are, and the last one, on the thing a candle cannot tell you — whether the price it printed at is one anybody defends.
There is a printable companion to the course: five pages covering the candles that mean doubt, the six formations, the protocol, and the swing definition the rest of it hangs off. It is free, and it arrives by email, because that is the only way I can send you a file.
This lesson also exists as a video, published , if you would rather be talked through it: Only 6 Patterns Actually Pay. The written version is the one that gets corrected.