The candlestick course · lesson two of six · Zonetta Trading
The candles that mean doubt
Nine shapes all say the same thing: both sides fought the whole window and neither of them won it. Read as a direction they are a trap. Read as a warning they are the most useful thing on the chart.
Written lesson · about seventeen minutes · free, and it asks for nothing
01 / The rule
Indecision is a warning, not a signal
Teal → bullish
Navy → bearish
Most bad trades have the same autopsy. The candle that hurt you is not the one that stopped you out. It is the one before it — the one that looked like nothing and was ignored.
A turn does not usually arrive out of a clear sky. Price stalls first, and the stall has a shape. Miss the stall and you end up reading the turn after it has already happened.
Lesson one split every candle into two families. Decision: a full body, almost no wick, one side owned the window from open to close. Indecision: a small body with long wicks, both sides fought and neither of them finished on top. This lesson opens the indecision family all the way up, one shape at a time.
Start with the part people get wrong. An indecision candle carries two meanings at the same time. The trend pauses and then continues, or the trend turns. The candle itself does not tell you which one you are looking at. That is not a gap in your reading. It is what the shape means.
So here is the rule the rest of this course runs on, and the reason this lesson comes before the lesson on formations. An indecision candle is a warning, not a signal. You wait for a full formation to confirm it before you act on it. Warning first. Confirmation second. Trade third. In that order, and never in a different one.
One piece of housekeeping before the diagrams start. In every diagram in this course, teal is bullish and dark navy is bearish. Teal means buyers won that window; navy means sellers did. The same convention runs through all six lessons.
Diagram · warning, confirmation, trade
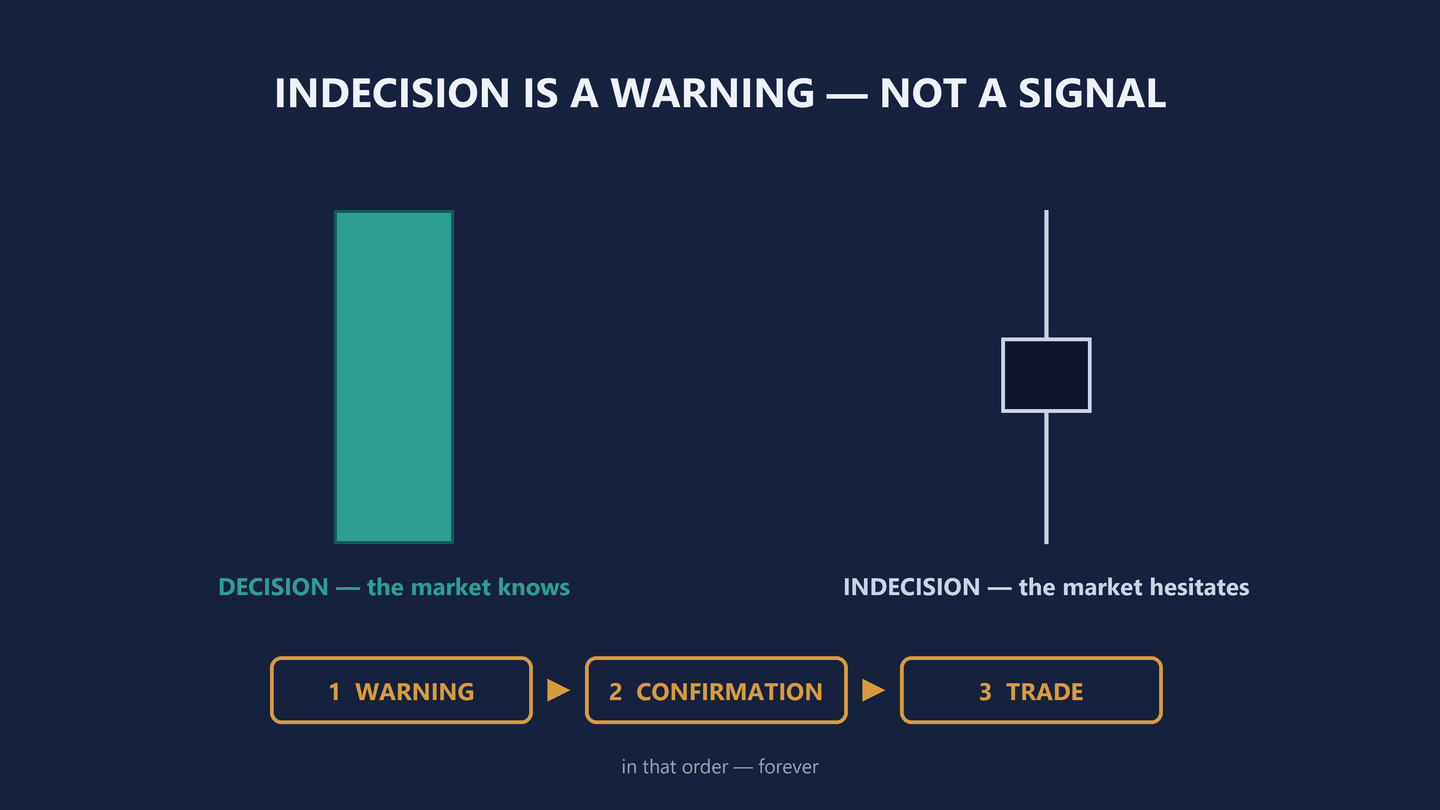
Diagram only · no instrument, no price, no outcome claimed
02 / The neutral pair
The two shapes with no winner
Candle one of nine is the doji star, also called the long-legged doji. Open and close land on the same price, with long wicks on both sides of it.
Read the shape as a sequence rather than a picture. Buyers pushed price up. Sellers drove it back down. When the window closed, price was sitting exactly where it started. Everything that happened inside cancelled out.
The doji does not know what comes next any more than you do. It can sit inside a continuation and it can sit at the start of a turn. The candle immediately after it is the one that answers, and there is a whole section on that further down this page.
Diagram · the doji star
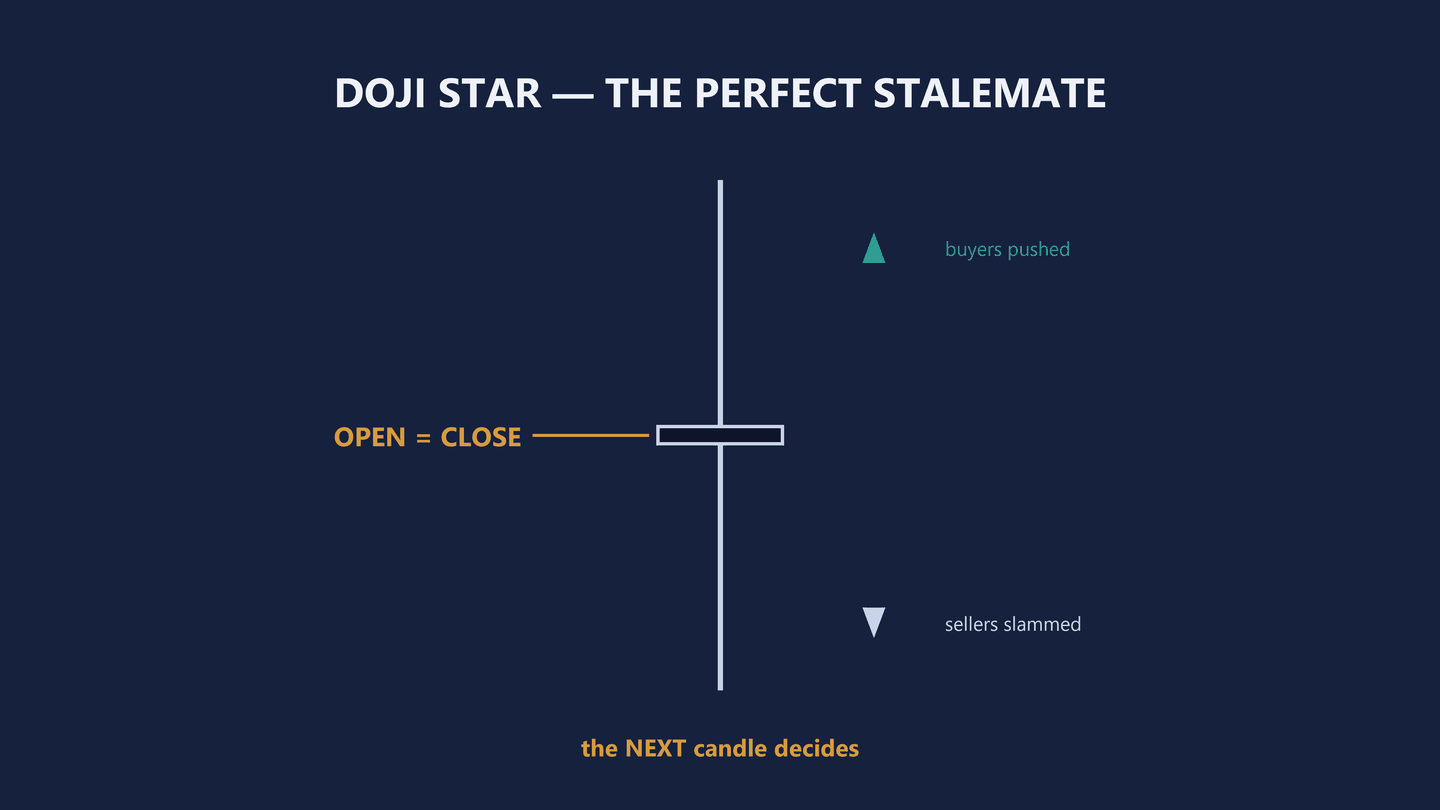
Diagram only · no instrument, no price, no outcome claimed
Candle two is the spinning top, a cousin of the doji with slightly more body. The distance from high to low is small, and the distance from open to close is smaller still. Whether it prints bullish or bearish does not matter: somebody won the window by a margin too thin to mean anything.
Same rule as the doji — continuation or reversal, and you wait for a confirmed formation either way. What is worth noticing is spinning tops stacking up at the end of a long run. One of them is nothing. Four of them in a row is an engine losing compression.
Diagram · the spinning top
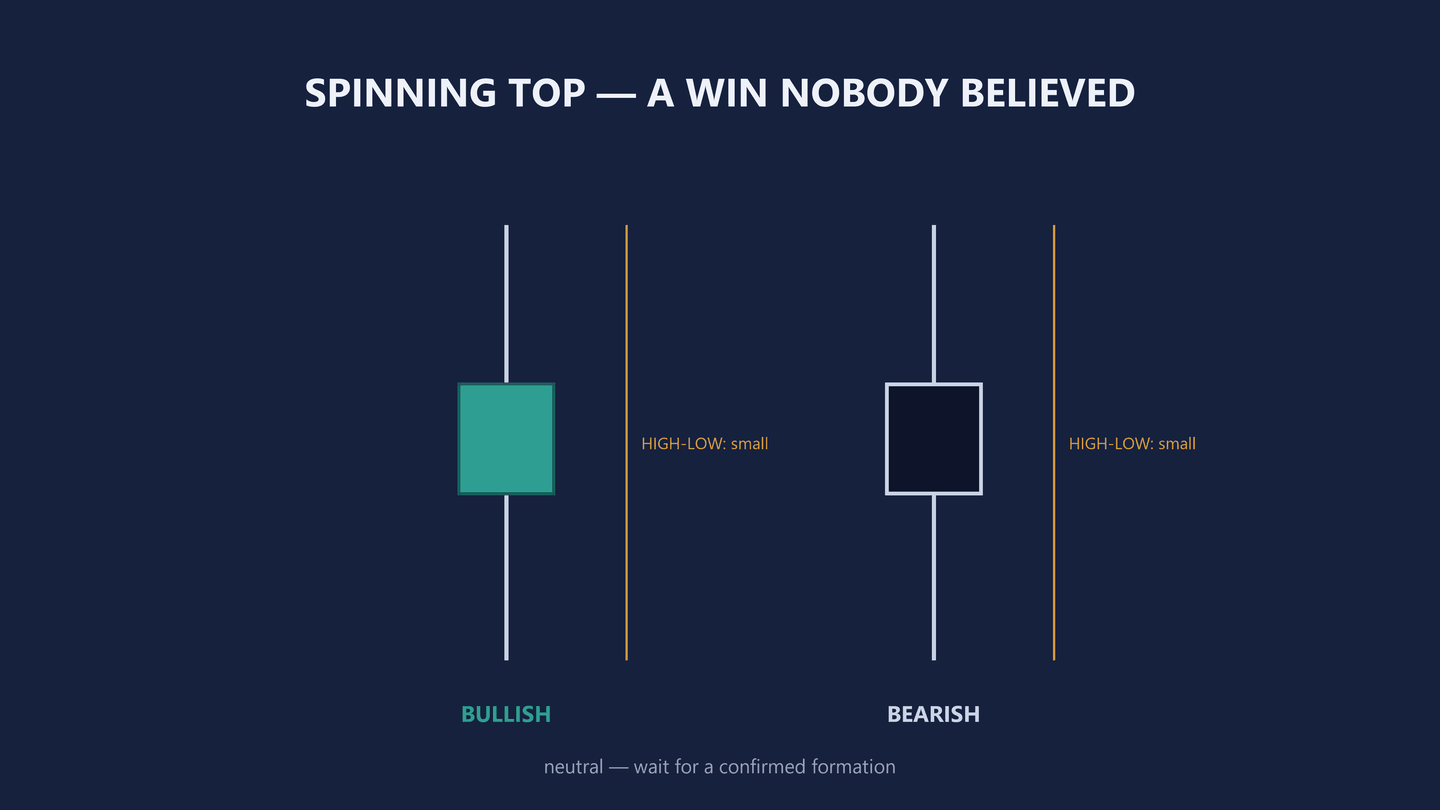
Diagram only · no instrument, no price, no outcome claimed
03 / One-sided dojis
When the wick is all on one side
Candles three and four are the dragonfly dojis. Open and close still land on the same price, but the wick is now almost entirely on one side of the body.
The bullish dragonfly has a lower wick far longer than its upper one. Price was driven down through the window and buyers dragged the whole move back before the close. The bearish dragonfly is the mirror: an upper wick far longer than the lower one, an entire rally handed back. Same body, opposite warning. One wick tells you who blinked.
Diagram · the dragonfly dojis
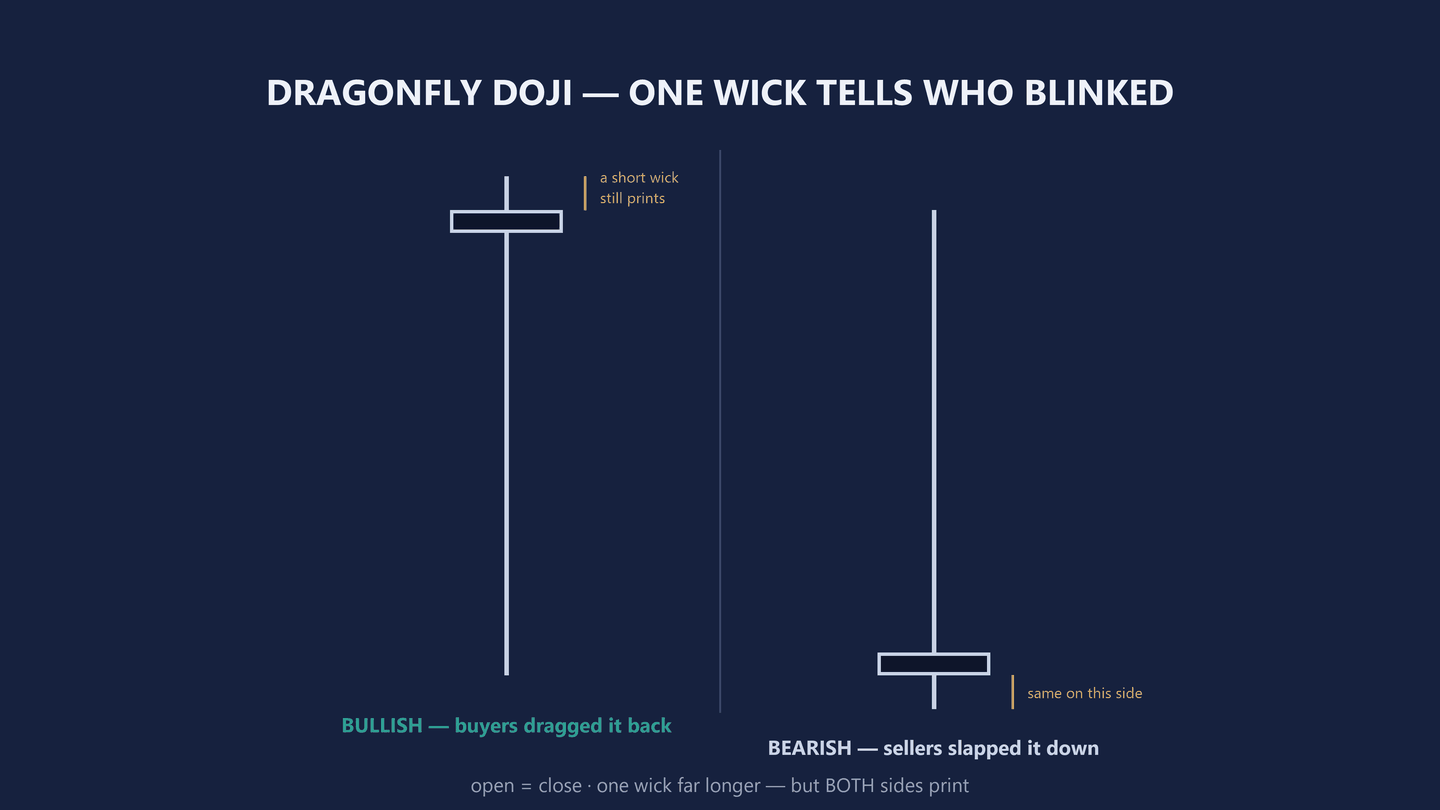
Diagram only · no instrument, no price, no outcome claimed
Candles five and six are the gravestone dojis, which carry the most dramatic name in the whole family and earn it.
The bullish gravestone puts open, close and high on the same price, with the low a long way underneath. The entire candle is a sell-off that failed. The bearish gravestone puts open, close and low on the same price, with a long wick reaching up: a rally that died at the top of the window and was buried there before it closed.
The difference between a dragonfly and a gravestone is small and worth being exact about, because it is the part that gets read carelessly. A dragonfly still prints a short wick on the other side of the body. A gravestone does not — three of the four prices land on the same line, which is why the body sits flat against the extreme of the range.
When a gravestone prints at the end of a long run, the market is showing you a grave. Whose it is comes down to what prints next.
Diagram · the gravestone dojis
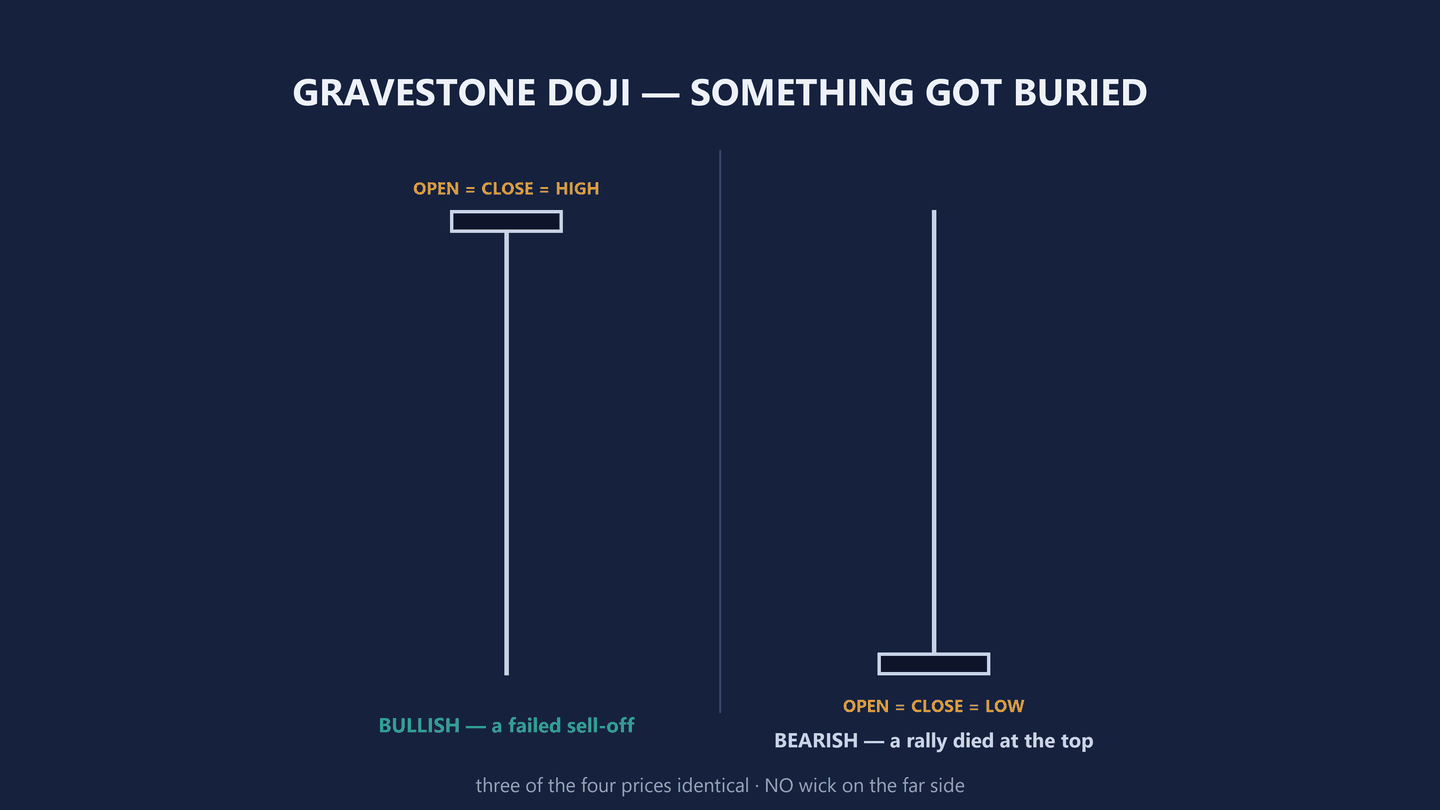
Diagram only · no instrument, no price, no outcome claimed
04 / Context
The same candle with two names
Candles seven and eight carry the deepest idea in the whole subject, and it is not about the shape at all.
Put the hammer and the hanging man next to each other and they are the same candle. A small body, one long wick, nothing else to tell them apart. What decides the name is the neighbourhood it prints in.
At the end of a real downtrend, with the long wick on the south side, it is a hammer and it reads bullish: sellers drove price down through the window and buyers hammered it back up before the close. At the end of a real uptrend, with the long wick on the north side, it is a hanging man and it reads bearish.
Identical shape. Opposite meaning. Context gives the candle its name — which is worth remembering every time somebody shows you a pattern with no chart around it.
Diagram · hammer and hanging man
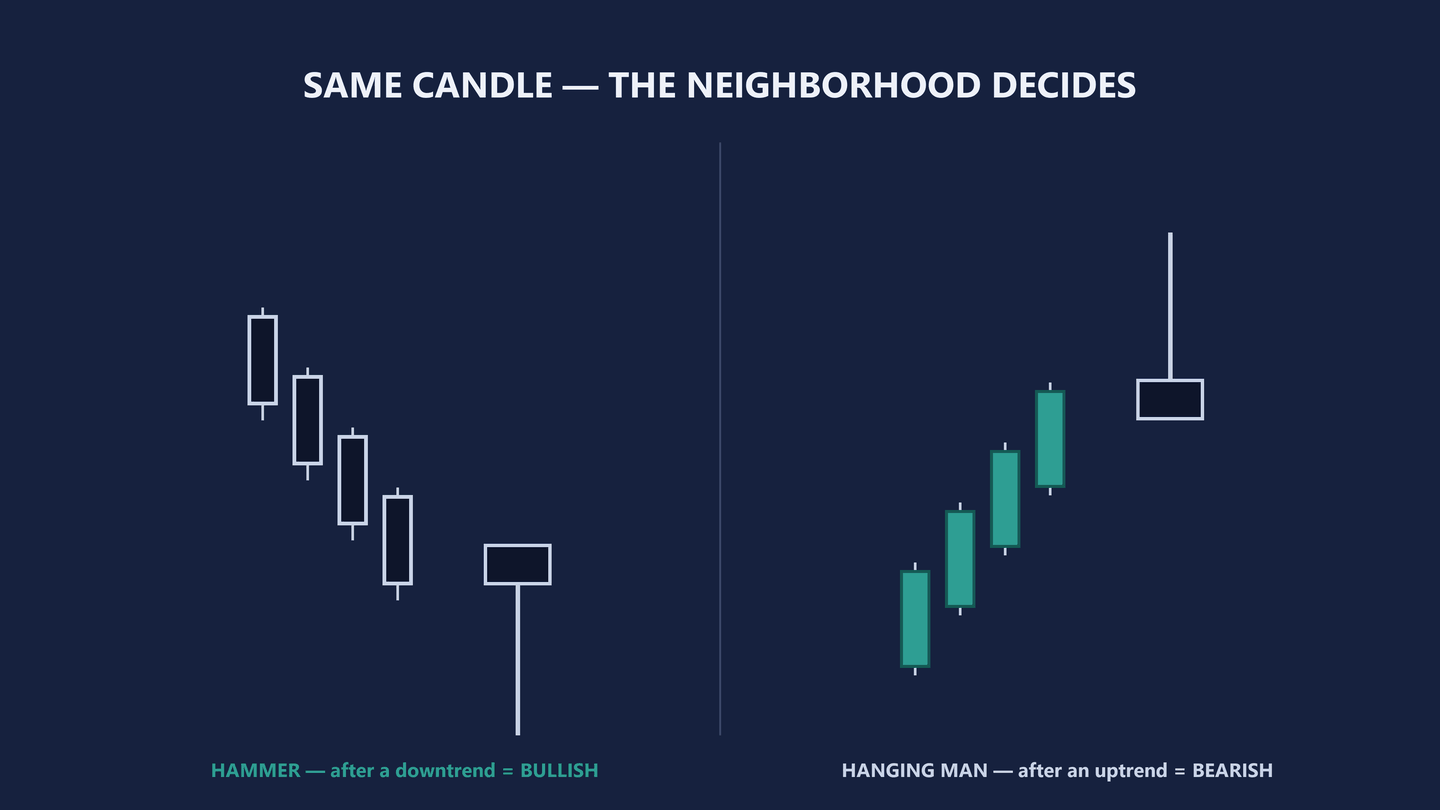
Diagram only · no instrument, no price, no outcome claimed
Candle nine is the shooting star. A spinning-top body, bullish or bearish, with one dominant wick — and it only counts when it arrives immediately after a move.
The bearish shooting star turns up at the end of a rally, north wick longer than the south. Price shot up, was rejected and fell back into the body before the close. The bullish shooting star is the mirror, at the end of a dip, south wick longer than the north.
Nine for nine. That is the entire family of doubt: every hesitation shape the market has to work with.
Diagram · the shooting stars
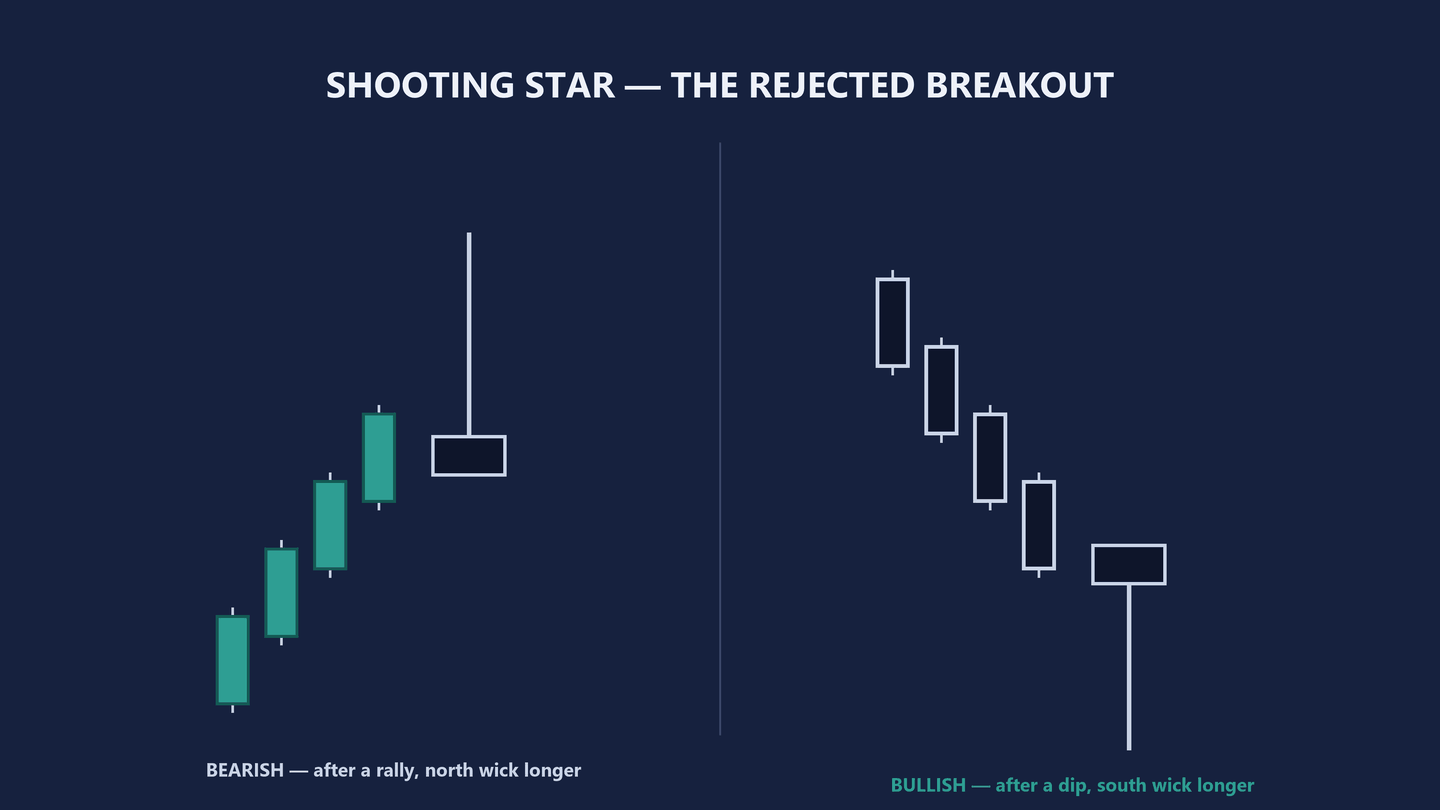
Diagram only · no instrument, no price, no outcome claimed
05 / The nine
All of them on one plate
Here they are together. The spinning top. The doji star. The bullish and bearish dragonfly. The bullish and bearish gravestone. The hammer. The hanging man. The shooting star.
This is the plate worth keeping. From here on, when price hesitates you are not looking at noise. You are looking at one of nine named shapes, and the name is the market saying out loud that it is no longer sure. Every turn has to pass through a moment like that before it becomes a turn.
Diagram · the nine candles of doubt
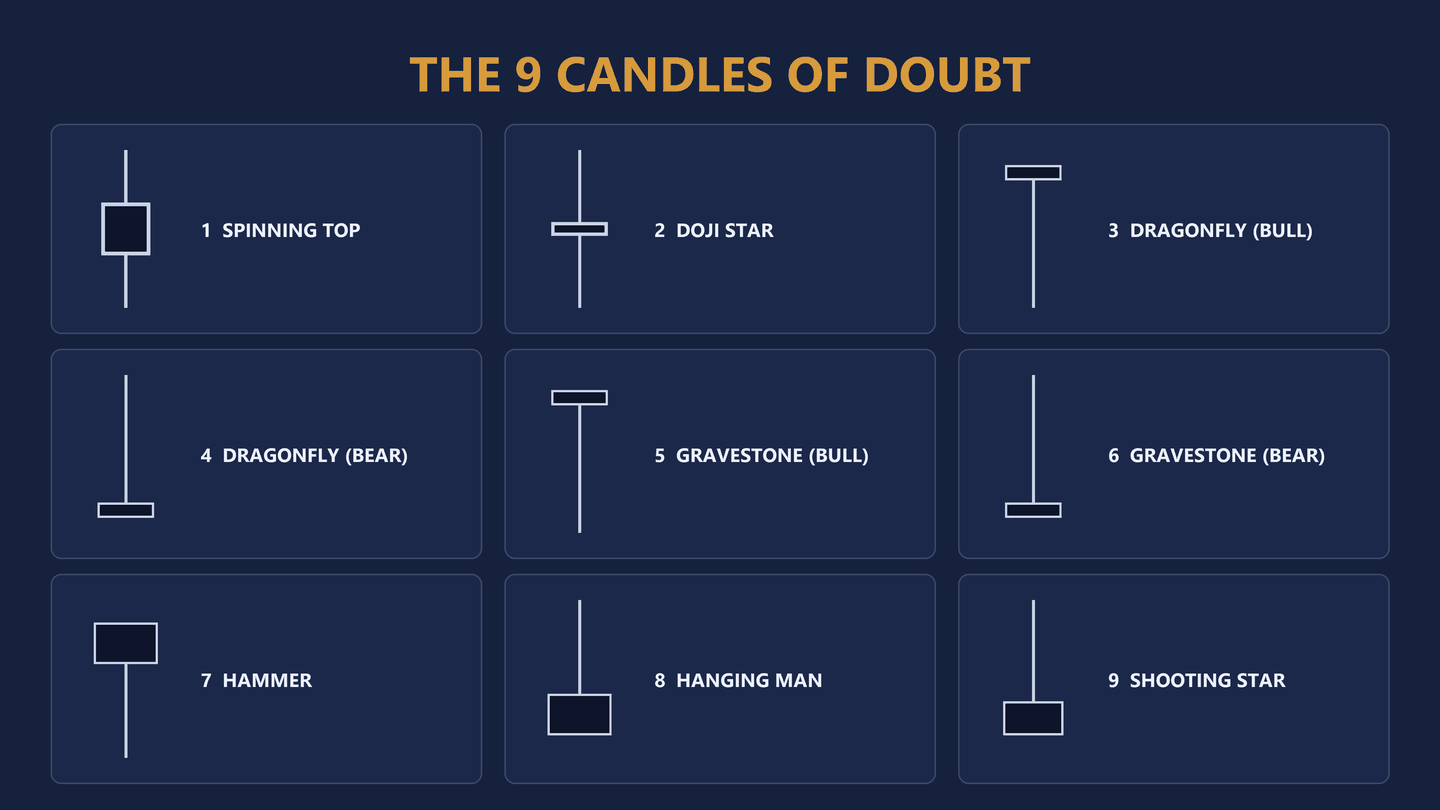
Diagram only · no instrument, no price, no outcome claimed
Naming the shape is not the trade. It is the moment you stop being surprised by what happens next, which is a different and much cheaper skill to own.
06 / Two-candle warnings
When there is no pause at all
Sometimes the market skips the hesitation entirely and hands you the warning across two candles instead of one. Both of the shapes below are measured the same way, and the measurement is the part that matters.
Dark cloud cover is the bearish one, and it needs a bullish move in front of it. A strong bullish candle, then a bearish candle that closes below the middle of that bullish body. Measure against the middle of the body, not against the wick. The deeper the second body cuts past that middle, the more the warning is worth.
Diagram · dark cloud cover
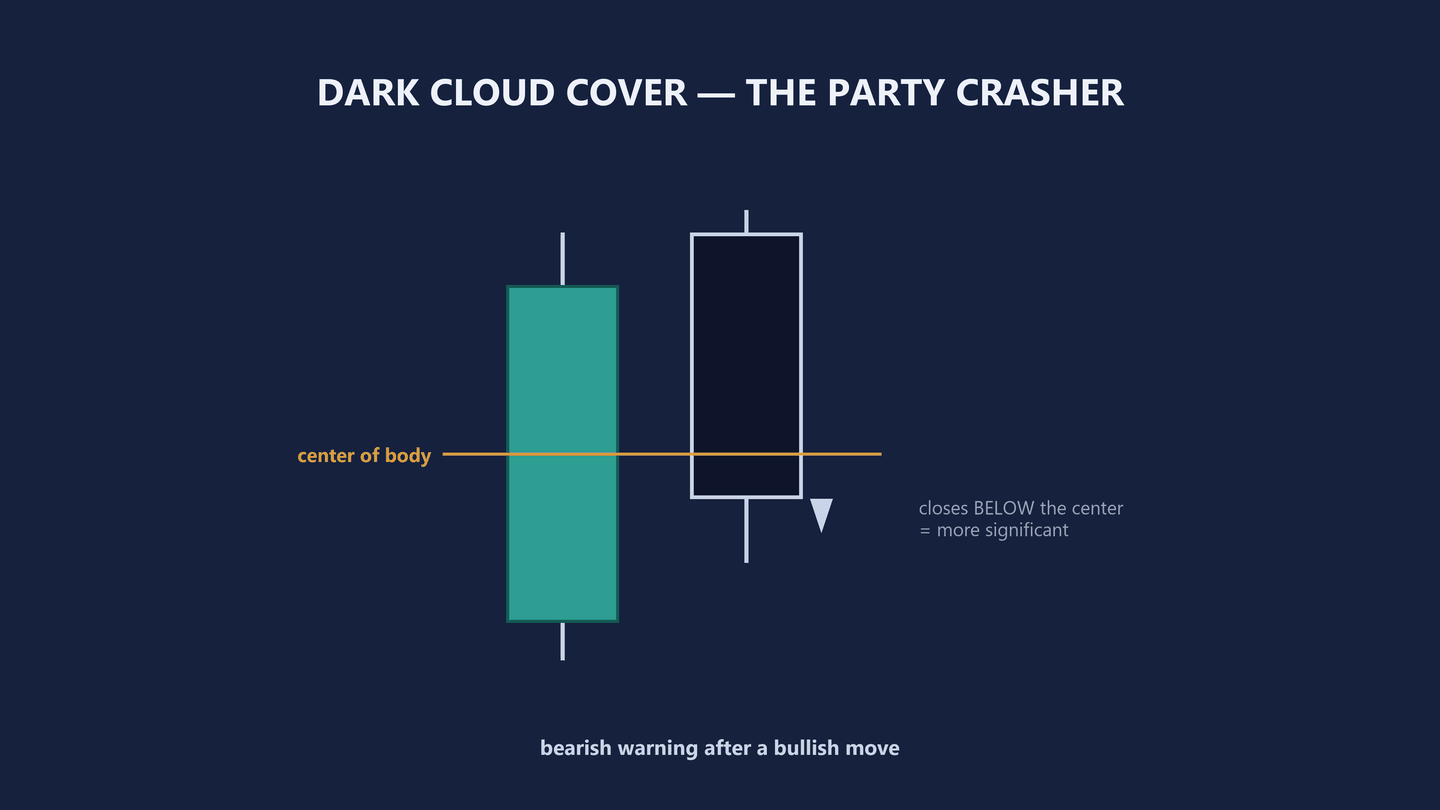
Diagram only · no instrument, no price, no outcome claimed
The piercing line is the same thing upside down. A strong bearish candle, then a bullish candle that pierces up and closes above the middle of that bearish body. The further above the middle it closes, the more the warning is worth.
Dark cloud cover on top of rallies, piercing line underneath sell-offs. Both are two-candle warnings, and both are still warnings: the rule from the first section has not moved.
Diagram · the piercing line
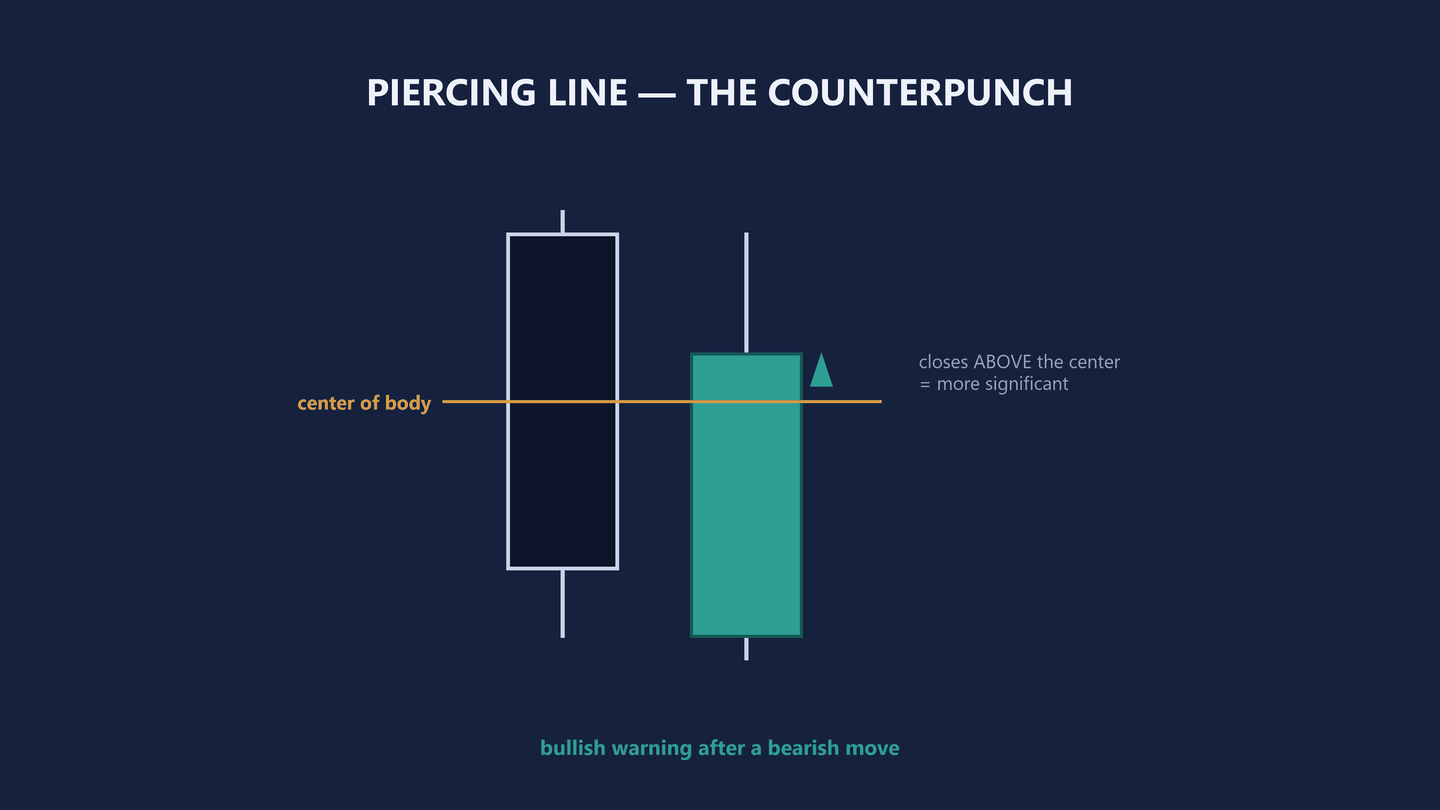
Diagram only · no instrument, no price, no outcome claimed
07 / Confirmation
The next candle votes
This is the part that turns a doji from a shrug into something you can work with. After a doji star prints, watch the candle immediately after it, because the market votes with that one.
If it is a bullish decision candle, it confirms the doji as bullish, and the three of them together may be building a morning star. If it is a bearish decision candle, it confirms the doji as bearish, and what may be building is an evening star. If it is another doji, you may be watching tweezers form.
Morning star. Evening star. Tweezers. Three of the six formations the third lesson takes apart, with the exact rule for each one. That is the handoff between the two lessons: this one gives you the warning, that one gives you the thing you are allowed to act on.
Diagram · what the next candle can be
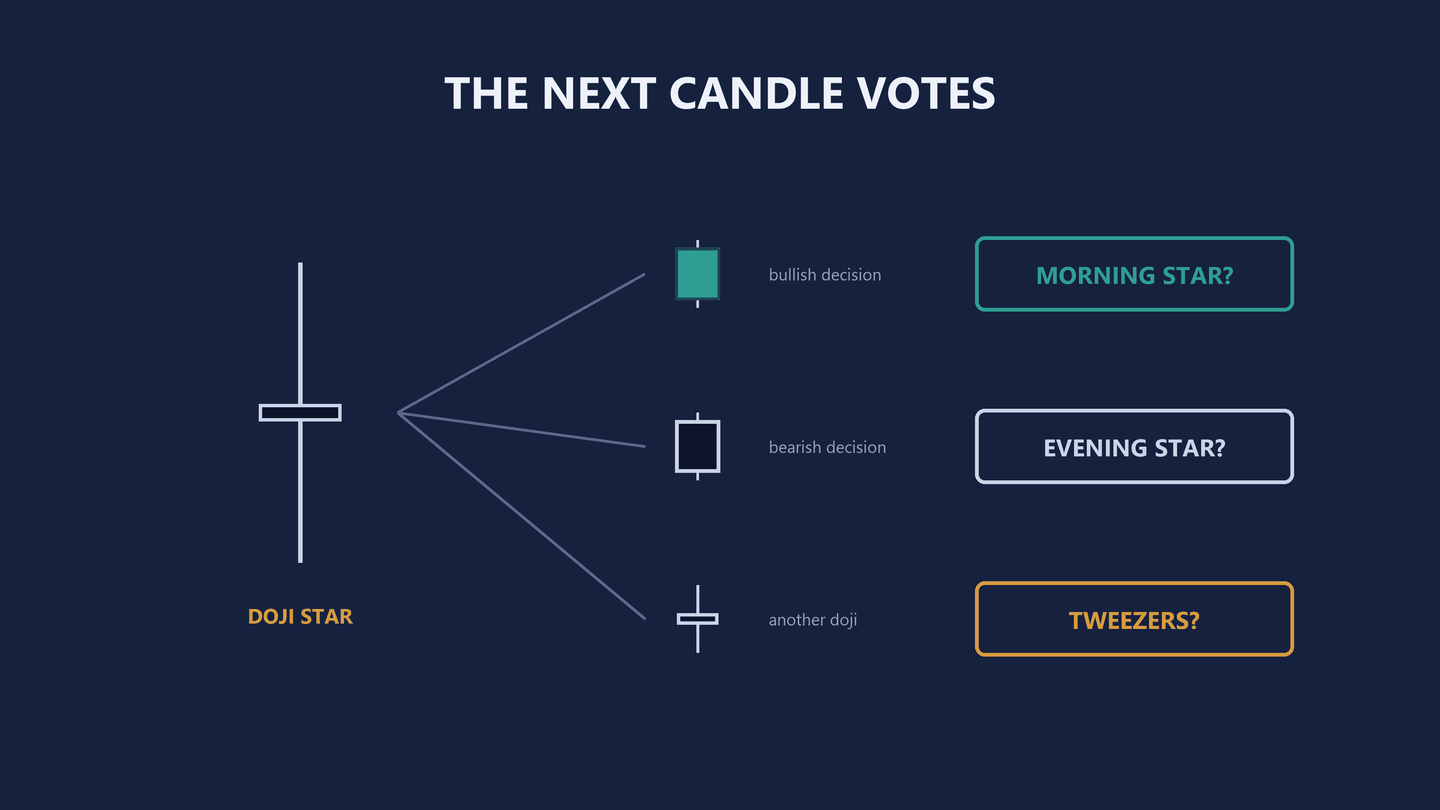
Diagram only · no instrument, no price, no outcome claimed
08 / Practice
Six readings, out loud
Cover the right-hand column and name the shape before you read the answer.
- Open equals close, a giant lower wick, little or nothing above
- Bullish dragonfly doji. Price was driven down and the whole move was taken back before the close. A warning, not an entry.
- A tiny body with small wicks on both sides of it
- Spinning top. Somebody won the window by a margin nobody believed, and the range was narrow while they did it.
- Open, close and low all on the same price, a long wick reaching up, after a rally
- Bearish gravestone doji. A rally that died at its own high. Now you wait for the next candle to vote.
- A small body with a long south wick, at the bottom of a downtrend
- Hammer, and it reads bullish. Move that same shape to the top of an uptrend, wick on the north side, and it is a hanging man reading bearish.
- A long teal body, then a navy body closing below the middle of it
- Dark cloud cover. A bearish warning after a bullish move, measured against the middle of the first body rather than its wick.
- A doji, then a full bullish body
- The vote came in bullish. That is a confirmed warning and a possible morning star — the point at which the third lesson takes over.
Then do it on your own chart rather than on mine. Open any instrument on any period, find the last five places where price stalled, and name the shape out loud before you scroll past it. Naming it is the whole skill this lesson was for. What to do about it is two lessons away.
09 / Recap
What to take away, and what comes next
- One
- Indecision is a warning, never a signal. Warning, confirmation, trade, in that order.
- Two
- The doji family — star, dragonfly, gravestone — puts open and close on the same price. The wick tells you who blinked.
- Three
- The hammer and the hanging man are one candle with two names. The run in front of it decides which name it gets.
- Four
- A shooting star is a rejected breakout: one dominant wick, arriving straight after a move.
- Five
- Dark cloud cover and the piercing line are two-candle warnings, measured against the middle of the first body.
- Six
- After a doji, the next candle votes. Until it prints, you have a warning and nothing else.
Doubt is only half the job. It is worth nothing until it turns into something you can act on, and that is what the next lesson is: six formations, three bullish and three bearish, with the exact rule for each and the argument for throwing the rest of the deck away.
After that comes the protocol — where the entry sits, where the stop sits, where the target sits, and when the honest answer is to leave the trade alone.
Six lessons are written, and this is the second. Both of the lessons this page used to describe as planned now exist: ten drills to prove you can see the shapes without being told where they are, and the last one, on the thing a candle cannot tell you — whether the price it printed at is one anybody defends.
There is a printable companion to the course: five pages covering the candles that mean doubt, the six formations, the protocol, and the swing definition the rest of it hangs off. It is free, and it arrives by email, because that is the only way I can send you a file.
This lesson also exists as a video, if you would rather be talked through it: The 9 Candles of Doubt (Read Them or Get Trapped). The written version is the one that gets corrected.
Next lesson: the six formations worth keeping → ← Back to lesson one All six lessons →