The candlestick course · lesson six of six · Zonetta Trading
Where the candle is standing
Five lessons taught you to read the shape. Not one of them could tell you whether the price it printed at was a price anybody defends. This one can, and it is the last thing candles need.
Written lesson · about fourteen minutes · free, and it asks for nothing
01 / The gap
The question the first five lessons deliberately left open
A hammer is a hammer anywhere on a chart. The same hammer at a level where large orders are actually defended is a trade. The same hammer in the middle of open space is a nice shape and a coin toss. Nothing inside the candle separates those two, and no amount of candlestick theory ever will, because a candle records what happened in a window of time and says nothing at all about the price it happened at.
That is not a flaw in the first five lessons. It is the boundary of what the notation can do. Reading a candle answers what just happened. This lesson answers where, and the two questions want different tools.
Everything below is free and it is complete. At the end of it you will be able to mark the places on a chart worth waiting at, decide which of them are still worth anything, and run the protocol from lesson four when one of the six formations prints inside one. That is a whole method. It is not the whole of my method, and section 10 says plainly what the difference is — but you can stop at section 09, go to a chart, and work.
02 / The zone
A zone is a pause between two moves
Price does not turn around at a line somebody drew afterwards. It turns around where there was more of one side than the other, and the place that happened leaves a specific signature: price arrives, stalls for a few candles, and then leaves in a hurry.
That stall is the base. It is where the imbalance sat. The band you draw around the base is the zone, and the reason you draw it is that whatever emptied that level once may still be sitting there when price comes back.
Two things about that definition are doing all the work. The zone is marked at the origin of a move, not at its destination. And it is marked before price returns, with both edges decided in advance. If you are drawing a zone while price is already inside it, you are not marking a level — you are writing a justification for a trade you have already decided to take.
Diagram · the base and its two edges
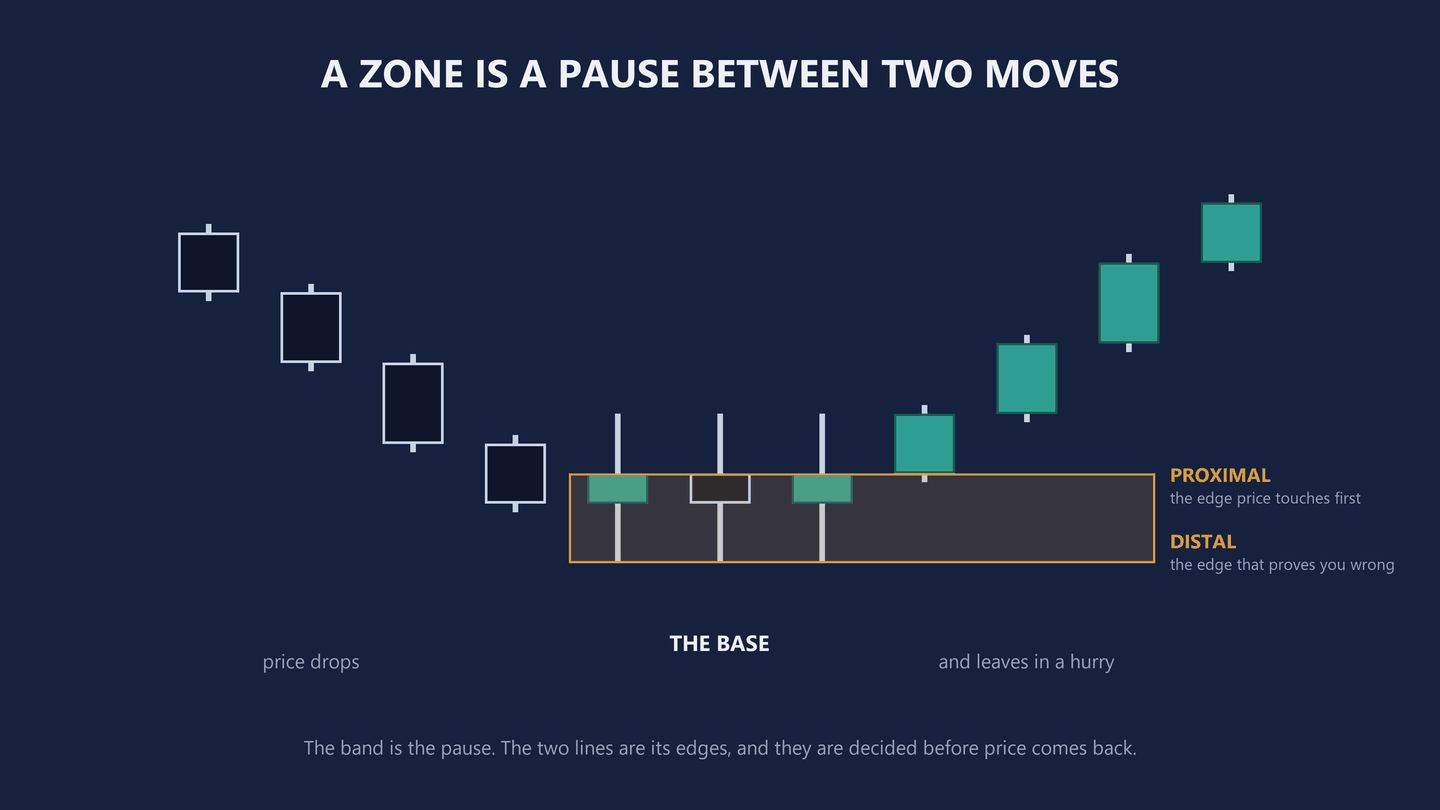
Diagram only · no instrument, no price, no outcome claimed
03 / The four shapes
Move, pause, move — four ways
There are exactly four, and their names are just the sequence read out loud. Two of them sit above price and are called supply; two sit below and are called demand.
- Rally, base, drop
- Price rallies, pauses, then drops away. Supply, above price.
- Drop, base, drop
- Price drops, pauses, then keeps dropping. Supply again — the pause is where sellers reloaded.
- Drop, base, rally
- Price drops, pauses, then rallies away. Demand, below price.
- Rally, base, rally
- Price rallies, pauses, then keeps rallying. Demand again — the pause is where buyers reloaded.
Traders write these as RBD, DBD, DBR and RBR, and the initials are worth knowing only because you will see them elsewhere. The idea underneath them is one idea: a move, a pause, and a move. The pause is the zone. What the two moves were doing tells you which side of price it belongs on.
Diagram · the four shapes
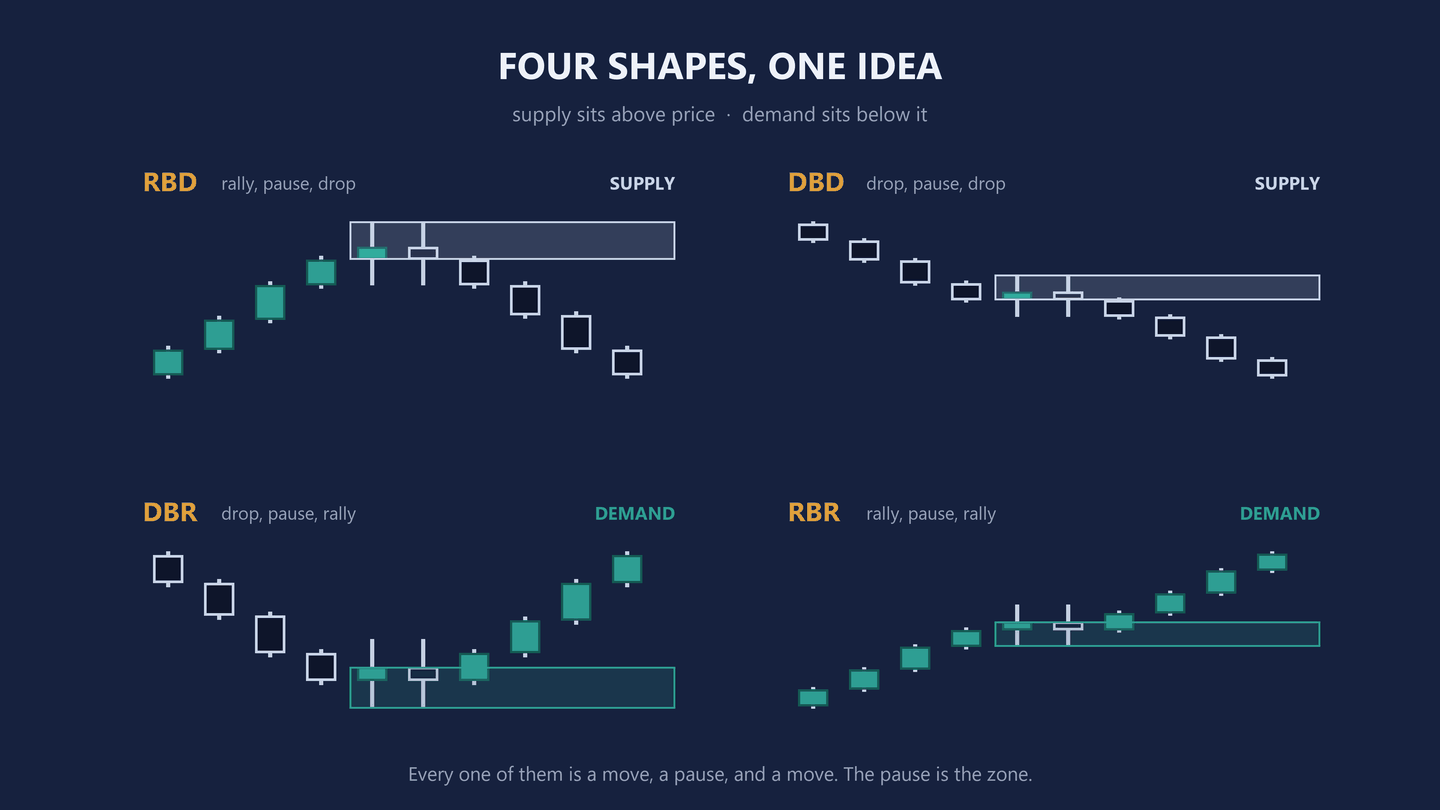
Diagram only · no instrument, no price, no outcome claimed
04 / The two edges
Proximal, distal, and why the names matter
A zone has two edges and they do completely different jobs.
The proximal edge is the one nearest to where price is now — the first edge price touches on the way back. On a demand zone that is the top of the base; on a supply zone it is the bottom. It is drawn at the body edge of the basing candles, not at the tips of their wicks.
Which body edge, when the base is more than one candle. Say the pause is four candles, each finishing at a slightly different price. Take the top of each body — the close on a bullish candle, the open on a bearish one — and the proximal line goes at the highest of those on a demand zone, at the lowest on a supply zone. One line for the whole base, at the body that reached furthest towards where price is now. Never the wick. The wick belongs to the other line.
The distal edge is the far one: the extreme the base reached, wicks included. That edge is not where you enter. It is the price at which you were wrong, and that is the whole reason it gets its own name and its own line.
If you have seen the same origin called an order block, or the gap it left behind called a fair value gap, you have not seen a different idea; you have seen a different rule for where the edge goes. Demand zone vs order block vs FVG puts the three side by side on the same candles.
To draw one: start where price is now and look left. For a demand zone, find the origin of a strong rally — the pause it launched from. For a supply zone, look left for the origin of a strong drop. Draw the two lines through the base without cutting through the bodies you are measuring, and extend both forward to the right, into the future, where price has not been yet. Then leave them alone.
The action rule is short. Price retraces back into a demand zone, and that is where a buy is considered. Price retraces back into a supply zone, and that is where a sell is considered. Considered — not taken. What turns considering into taking is lesson four, and it has not changed.
05 / The first bridge
You already know how to read the inside of a zone
Here is the part that surprised me when it landed, years after I should have seen it.
What is a base made of? Small bodies. Long wicks on both sides. Neither side finishing on top. Candle by candle, a base is a run of the shapes lesson two spent a whole page naming: spinning tops, dojis, the candles that mean nobody won.
Which means the middle of a morning star and the base of a demand zone are the same object at two magnifications. The star's two small candles are a base, one or two candles wide, on a smaller clock. You have been reading the inside of zones since lesson two. Nobody told you that is what you were doing.
That connection also settles a question lesson two raised and left hanging. One spinning top is nothing; four in a row is an engine losing compression. In the zone method the same instinct is a measurement: count the basing candles, and one to three is the best a pause can be, four to six is middling, and more than six is poor. Less time at a level means the imbalance resolved faster, and a level that took a long time to leave was never much of an imbalance.
Diagram · the same pause, two magnifications
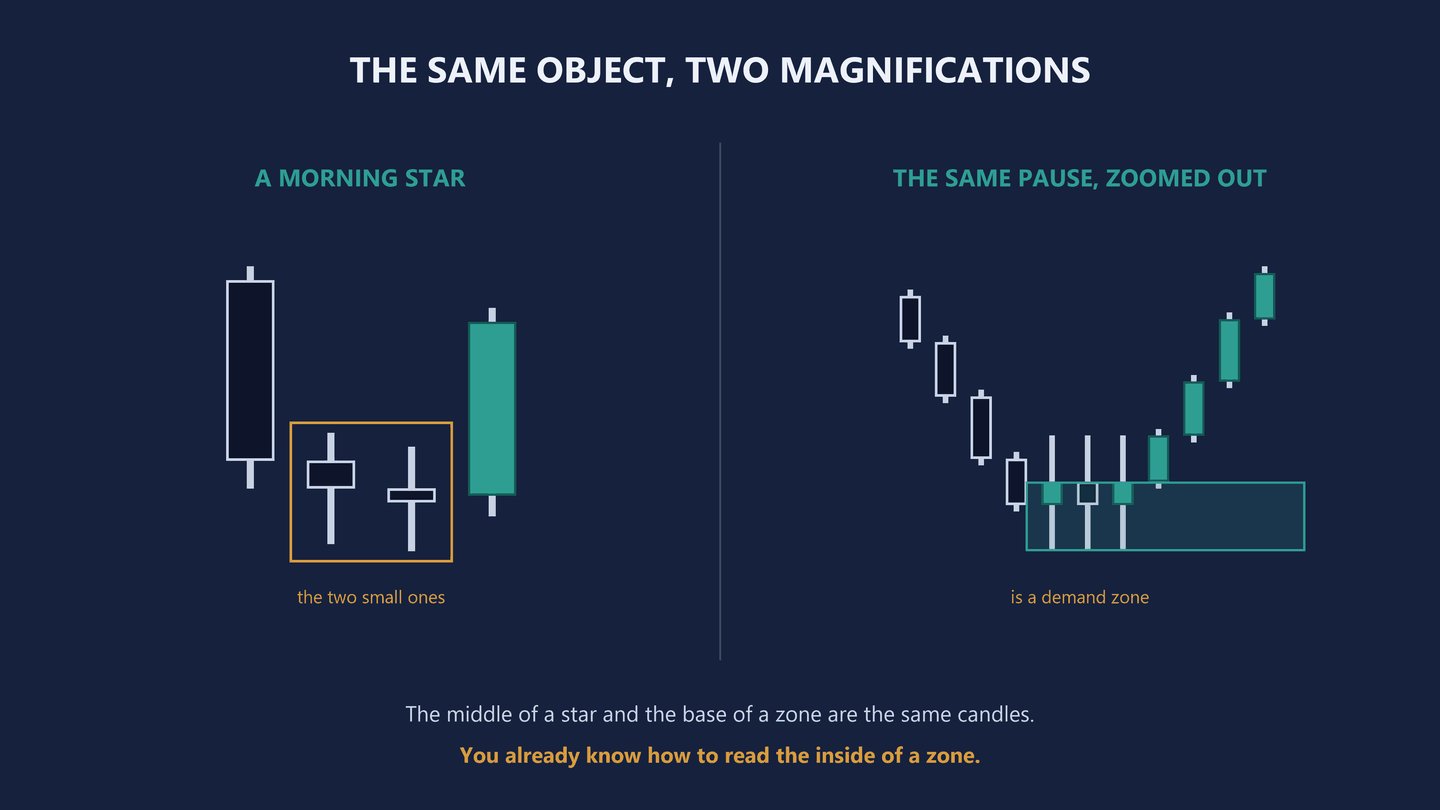
Diagram only · no instrument, no price, no outcome claimed
06 / The second bridge
An engulfing candle is a move-out in miniature
Lesson three described a bullish engulfing as one candle erasing the sellers' entire previous move, and then some. Read that sentence again with zones in mind and it is a description of price leaving a level in a hurry — the same event, compressed into a single bar.
On the zone side the same idea is called the move out, and it is measured rather than admired: a run of candles closing consecutively in the same direction, from the proximal line to the extreme of the move. The requirement is that the move travels at least twice the height of the zone it came from. Zone is one, move is two or more, and if it is not, the level did not leave hard enough to be worth waiting at.
So the escalation is the teaching point. An engulfing candle is one bar of imbalance. A move out is several bars of it with a ratio attached. Both are the market saying the same thing: at that price the two sides were not merely unequal, they were out of balance enough to leave a mark.
Diagram · one bar of imbalance, and several
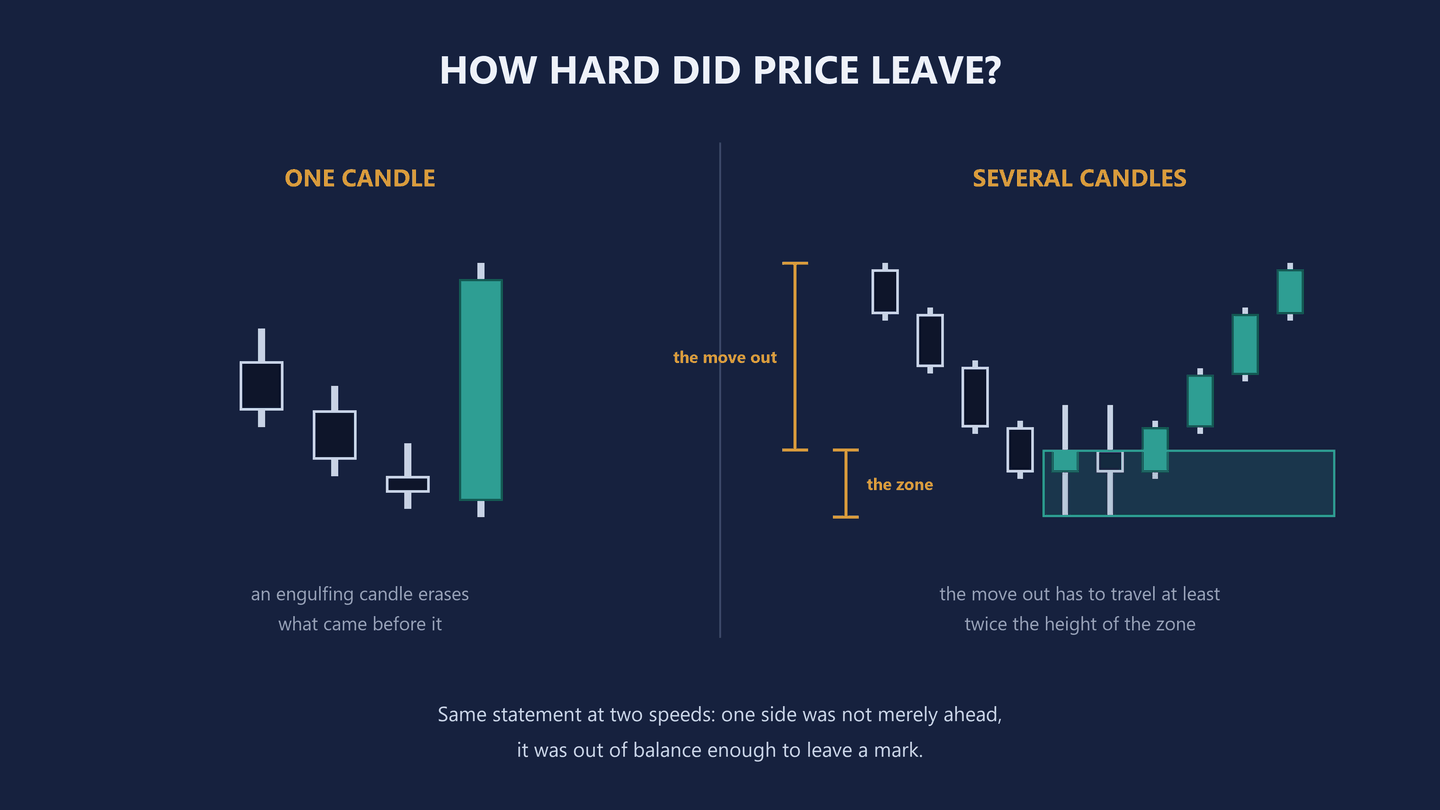
Diagram only · no instrument, no price, no outcome claimed
07 / The third bridge
Fresh, tested, violated — and the one you throw away
Lesson four told you the market frequently comes back and touches the high or the low of the formation you just traded, that it is a probe, and that your stop has to sit far enough beyond the extreme to let the probe happen without taking you out. That is the whole of the freshness idea already, one candle wide.
Zones grade the same event instead of treating it as a yes or no.
- Fresh
- Price has never come back. Whatever was sitting there has not been spent, and this is the best a zone gets.
- Tested
- Price came back and dipped in. Some of what was there has been used. Half the zone or less is still worth something; deeper than that, much less.
- Violated
- Price crossed the distal edge. Not a lower grade — the zone is finished. Take it off the chart and do not trade it.
If you take one thing from this page and never read another word of mine, take that last row. Most beginners do not lose money on zones they drew badly; they lose it on zones that were already spent, drawn weeks ago, still sitting on the chart looking authoritative. A level that has been cut through is not a level. It is a memory.
And notice the symmetry with lesson four's stop. The buffer beyond a formation's extreme and the stop beyond a zone's distal line exist for the identical reason: the test needs somewhere to happen that is not your account.
Diagram · three states of one zone
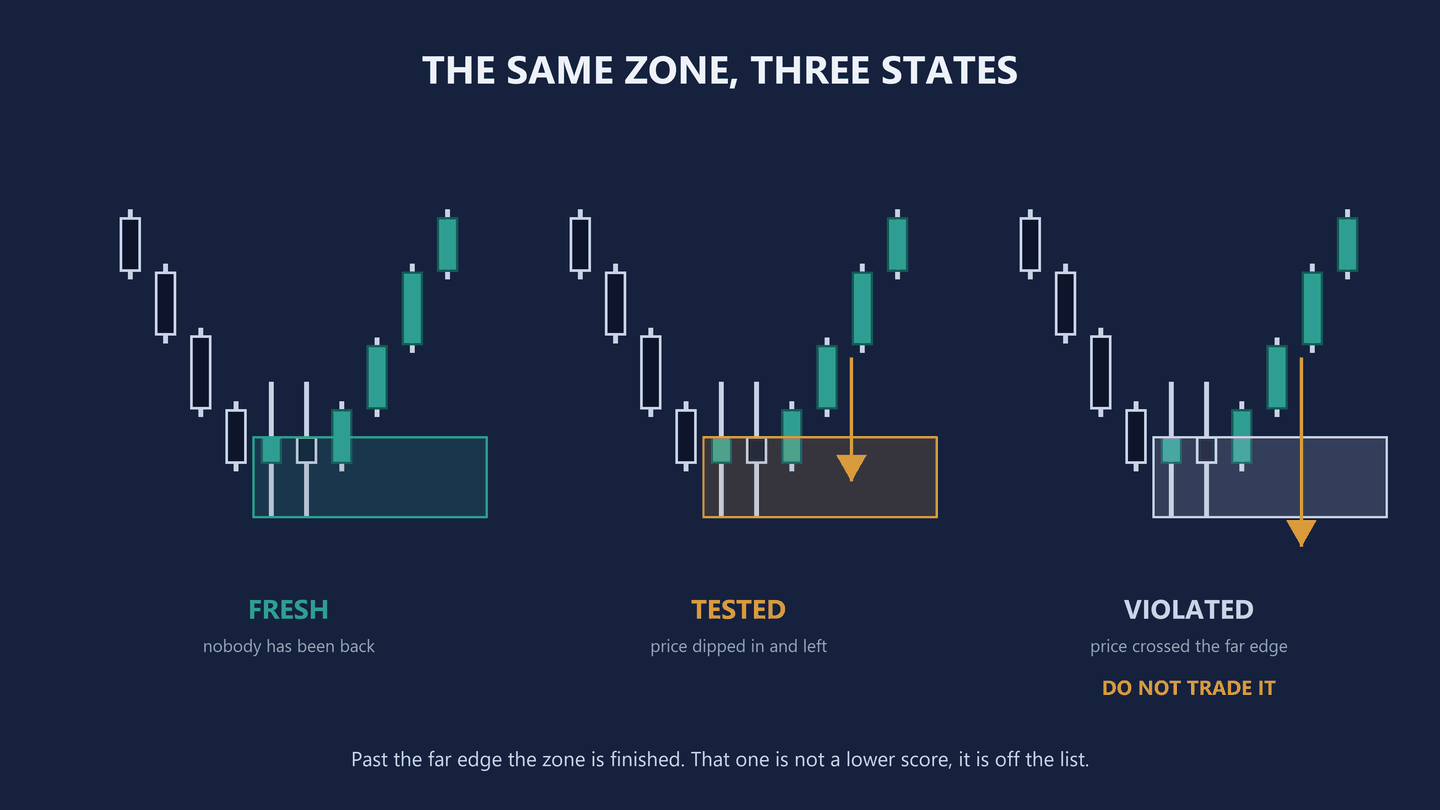
Diagram only · no instrument, no price, no outcome claimed
08 / The fourth bridge
Two rules from lesson four turn out to be one question
Lesson four gave you two instructions and no way to weigh them. Do not trade formations in consolidation. Trade only in the direction of the trend on the larger timeframe. You either obeyed them or you did not.
In the zone method those two are a single question about location, and it is asked of every zone before price arrives: is acting here going with the dominant direction, sideways to it, or against it? With the trend is the best case. Sideways is middling. Against it scores nothing at all, however good the zone looks in isolation.
That is the difference between a rule and a score, and it is worth naming out loud. A rule is obeyed or broken. A score can be compared. Once location is a number rather than a commandment, two zones on the same chart stop being interchangeable, and choosing between them stops being taste.
Diagram · one shape, two places
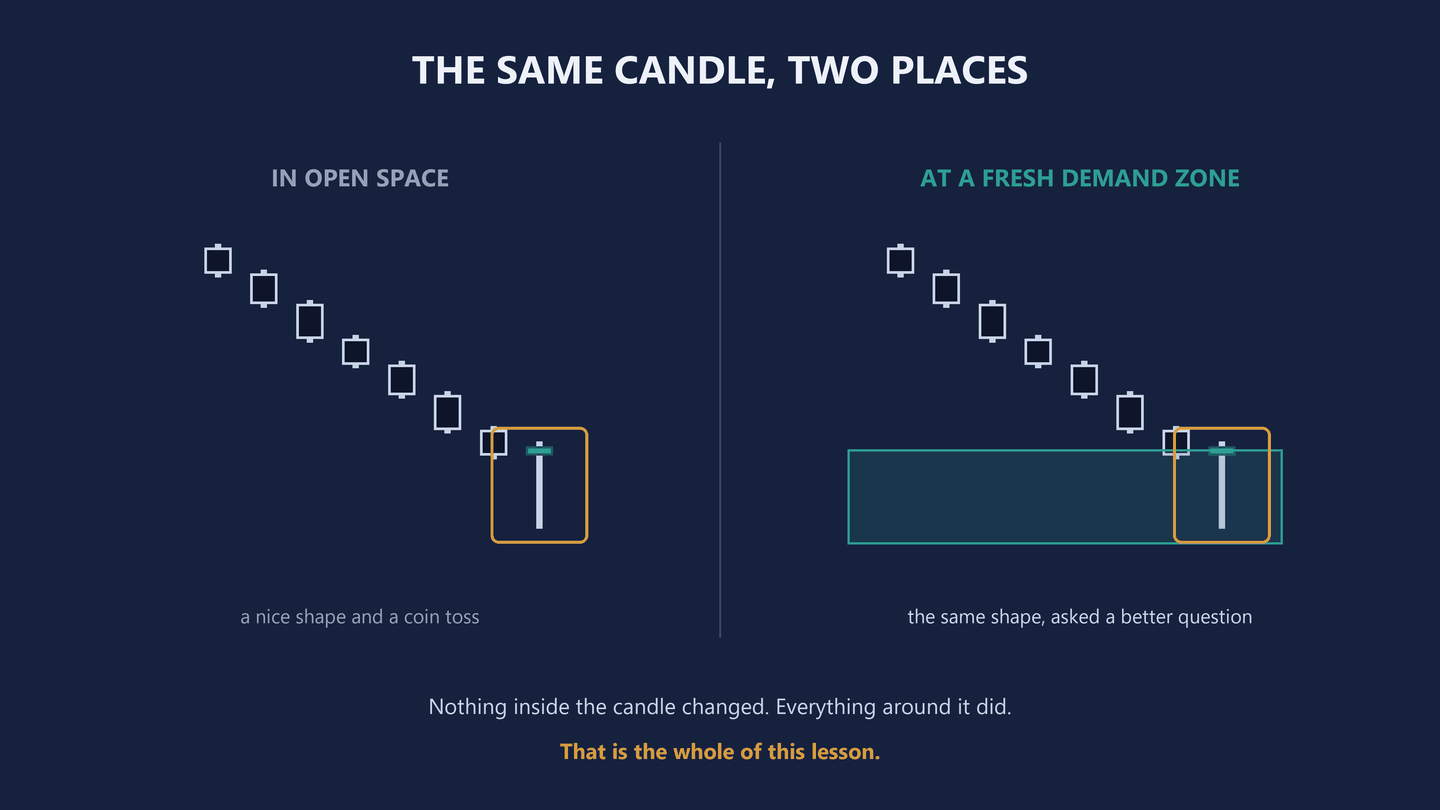
Diagram only · no instrument, no price, no outcome claimed
Which is the answer to the question at the top of this page. The hammer did not change. The chart around it did, and the chart around it was always the part carrying the information.
09 / The whole thing
What you can do with all six lessons, starting today
This is the end of the course, so here is the method in the order you would actually run it. Nothing in this list needs software, a subscription, or anything else from me.
- One
- Mark the zones. Look left from where price is now and find the pauses that strong moves began at. Draw the proximal and distal lines and extend them forward.
- Two
- Throw most of them away. Anything price has already cut past the distal line on is finished. Anything the market crawled out of rather than left in a hurry was never an imbalance. Anything that would have you trading against the larger timeframe is not your trade today.
- Three
- Wait. This is the step that costs nothing and gets skipped anyway. Price has to come back to a zone you already marked, not to a level you find once it is there.
- Four
- Read the candle. When price is inside the zone, one of the six formations from lesson three is what turns a place into a moment.
- Five
- Run the protocol. Entry, stop and target exactly as lesson four wrote them, with the stop beyond the distal line rather than beyond the formation alone.
Do that on a chart nobody is trading until the order is automatic. You will mark zones badly at first, and marking them badly where it costs nothing is the only way anybody has ever learned to mark them well.
That is the end of the written course. Six lessons: what a single candle records, the shapes that mean the market could not decide, the six formations worth carrying, the protocol that turns one into a decision, ten plates to prove you can see them, and the place on the chart that decides whether any of it was worth doing.
This lesson also exists as a video, published , if you would rather be talked through it: Candles Are Tiny Zones (The Bridge). The whole course is on one playlist, in order. Where a video and a page disagree, trust the page — the written lessons are the ones that get corrected.
The course, all six lessons → Lesson five: find the formation →
10 / After this
What the paid course adds, and what it does not
Two lessons ago, at the end of lesson four, I wrote that this page would be the idea and not a trailer with the ending cut off. You have just read it, so you are the one qualified to say whether I kept that. Nothing above was held back, nothing stops halfway, and the method up there works without me.
Now let me take the obvious objection away from you, because it is a fair one. The definition is not what I am selling and I do not keep it. A zone is the place a move began. Four things about it are worth measuring — how hard price left it, how long the base took to build, whether anyone has been back since, and where it sits in the larger trend. Those four add up to a score out of seven, and below three and a half I do not take the trade. Every word of that is already on this site for nothing, written out properly on the method page and, for the grade itself, on the Zone Score page, and it is on the free checklist as well. If that is all you wanted, you have it, and you can close this page.
What the course teaches is doing it. Marking the zone and grading it by hand, in about ten seconds, on a chart you have never seen before — and building the judgement to throw most of them away, which is the part that actually costs people money to learn. That takes thirty-nine lessons because it is a skill. A definition takes one page, and you have just read the page.
Four minutes of me explaining it, in my own words:
Presentation video · 4:10 · captions on · autoplay off
- What it is
- Seven modules, 39 lessons, six hours and fifty-five minutes. One payment of $697, lifetime access.
- What it teaches
- Marking a zone and grading it by hand in about ten seconds, on any chart, with nothing running. And the judgement to reject most of them, which is the harder half.
- What is not in it
- The indicator, and the MT5 robots. They are separate products, sold separately, and neither of them comes with the course. Better you read that here than find out at checkout.
- If it turns out not to be for you
- Watch module three and do its drill — that is where the method either lands or does not. If you have done that and still think it was not worth the money, write to me inside fourteen days and I refund you.
And if the answer is no, that is a whole answer and it costs you nothing here. These six lessons are not a trial and they do not expire, and none of it moves behind a wall later. They were free before there was anything to sell you, and they stay free after.