The candlestick course · lesson four of six · Zonetta Trading
Entry, stop and target
A formation tells you where the market might turn. It does not tell you what to do about it. This lesson is the part that does: five steps, in the same order, every trade.
Written lesson · about nineteen minutes · free, and it asks for nothing
01 / The gap
A formation is not a trade
By now you can read a candle, name the shapes that mean the market could not decide, and pick out the six formations worth keeping. None of that is a trade.
A formation tells you where the market might turn. It says nothing about when you click, where the stop goes, where you get out, or when the correct move is to leave the chart alone. Those four questions are the whole of this lesson, and the fourth one is the one that gets skipped.
The difference between clicking on a pattern and running a protocol is that a protocol is the same every time. Five steps, in order, with a number or a rule attached to each. One entry rule, two stop numbers, one target method, one ratio, and one rule for walking away. The walking-away rule is the one people skip. It is also the only one in the list that costs nothing to obey.
02 / The protocol
Five boxes, every trade
Here is the whole thing before it gets broken up.
Step one — establish the trend, with lines you actually drew rather than a feeling about the chart. Step two — wait for one of the six formations to complete, in the right location. Step three — enter at the open of the next candle, never before the formation closes. Step four — place the protective stop a fixed distance beyond the formation’s extreme. Step five — set the target at past structure and check the ratio before you commit to anything.
Five boxes. All five tick, or there is no trade. Step two is the one the previous three lessons were about, and it is one box out of five.
Diagram · the five boxes
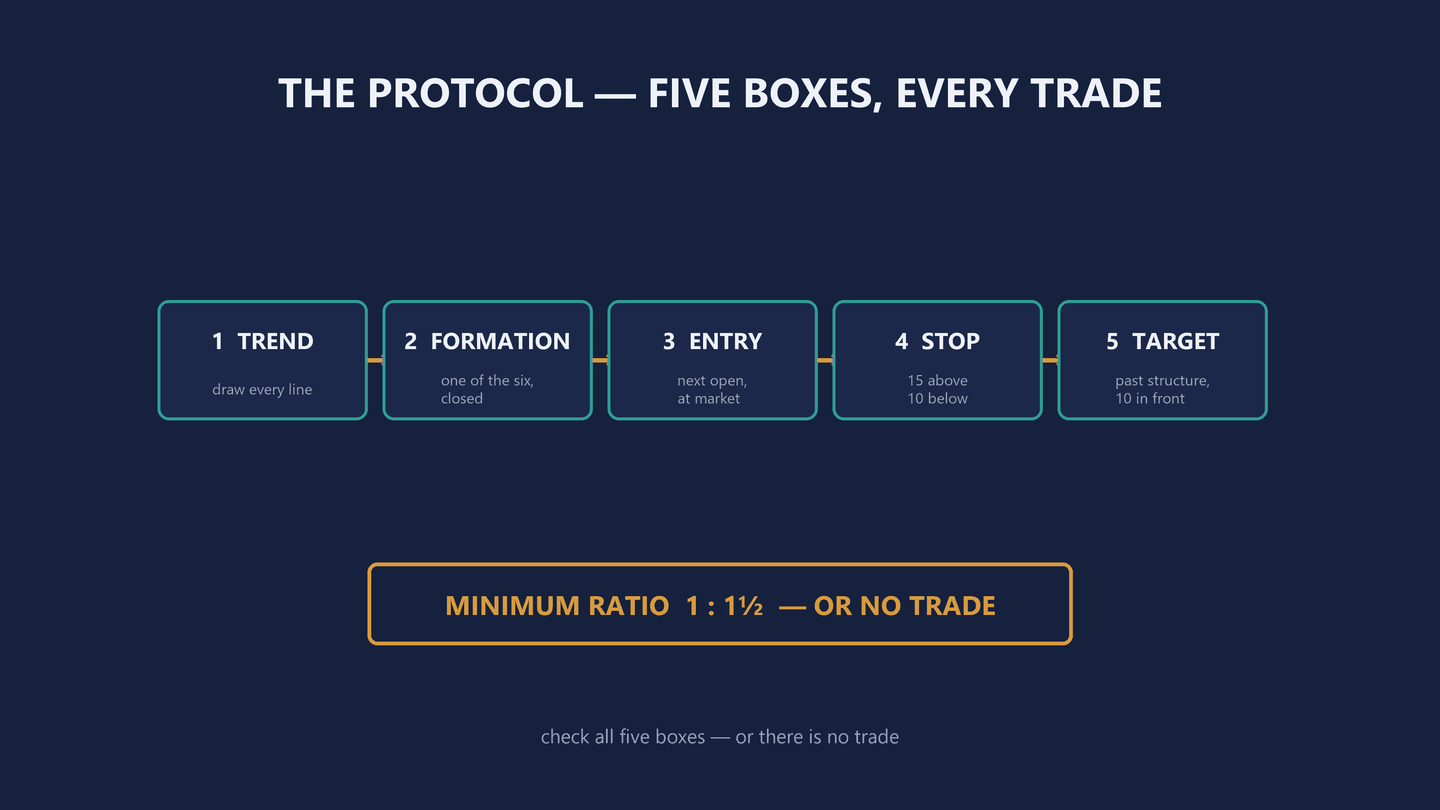
Diagram only · no instrument, no price, no outcome claimed
03 / Trend
Step one, and where you are allowed to look
15M → 1H
30M → 2H
1H → 4H
Draw all your trend lines. Inner, outer, long-term. Not one line — all of them. They answer three questions: is the market in an uptrend, is it in a downtrend, or has a line just broken. The third answer is the reason you draw the ones that look redundant, because a broken line is the earliest warning of a reversal you will get from structure alone.
Then the reading. Candles trading above the uptrend line means the market is on the bullish side of its own structure, and the trade you look for is a long one. Candles below the downtrend line means the bearish side, and the trade is a short one. You take the side the lines say the market is already on.
The script this lesson is written from puts a percentage on that — an eight-out-of-ten. I have taken it out, and I am not going to replace it with a different number. I have never seen the sample it was measured on, over what period, on which instrument, and neither has anybody who repeats it. The same position is on the page that sells my paid course: I will not tell you how much money you will make, and I will not quote you odds I cannot source.
The rule survives the deletion intact. The lines tell you which side the market is currently on. Taking the other side means being right about a turn before the chart is, which is a harder trade to be right about — and you do not need a statistic to know that. Draw the lines, and stop arguing with them.
The bigger chart votes first
Same step, second rule: trade only in the direction of the most current trend on the larger timeframe. The ladder is fixed and it is in the margin of this section. Trading the fifteen-minute chart, you follow the one-hour. Thirty minutes, follow the two-hour. One hour, follow the four-hour.
Once the bigger chart has voted, your shopping list is set for the session. Trend down and you are hunting Evening Stars, Tweezer Tops and Bearish Engulfing candles, and nothing else. Trend up and it is Morning Stars, Tweezer Bottoms and Bullish Engulfing. Half the catalogue from the previous lesson goes in the drawer on any given day. That is not the method being restrictive. That is the filter doing the job you built it for.
Diagram · the timeframe ladder and the shopping list
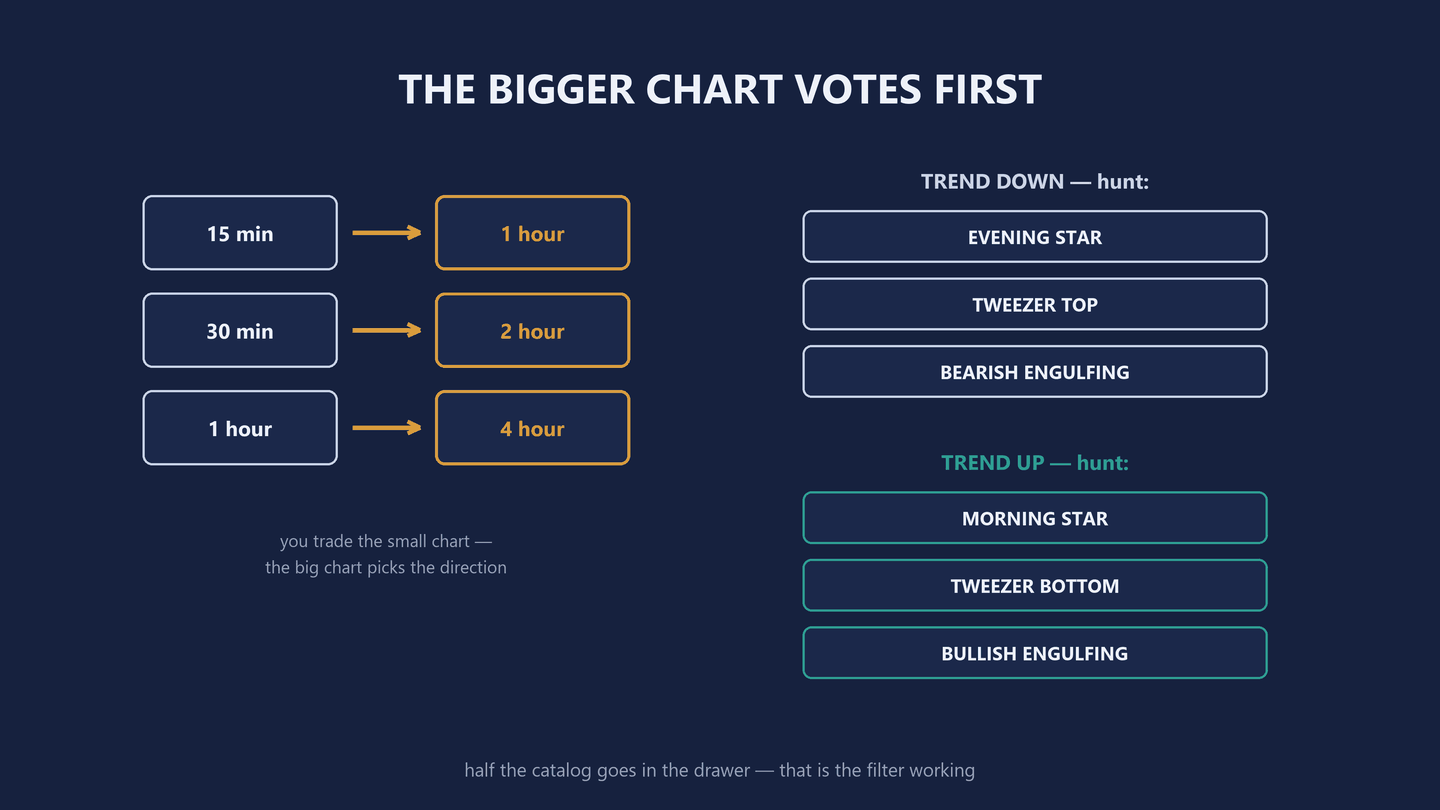
Diagram only · no instrument, no price, no outcome claimed
Trade the wave, never the box
And one place where the protocol says stand down. Do not trade candlestick formations in consolidation. When the market is moving sideways inside a box, every shape you find is noise trapped between two walls, and the formation you recognise is a coincidence of where the walls happen to be.
Trade the wave instead. A trend breathes as it moves: it waves back, it retraces, it gives ground and takes it again. That retrace is the moment. Watch for one of your six formations to print at the end of the pullback, pointing back in the direction the bigger chart already voted for.
Formation, at the end of a retrace, with the larger timeframe behind it. That is the sequence this method is built around, and everything else in the protocol is a way of pricing it.
Diagram · the box and the wave
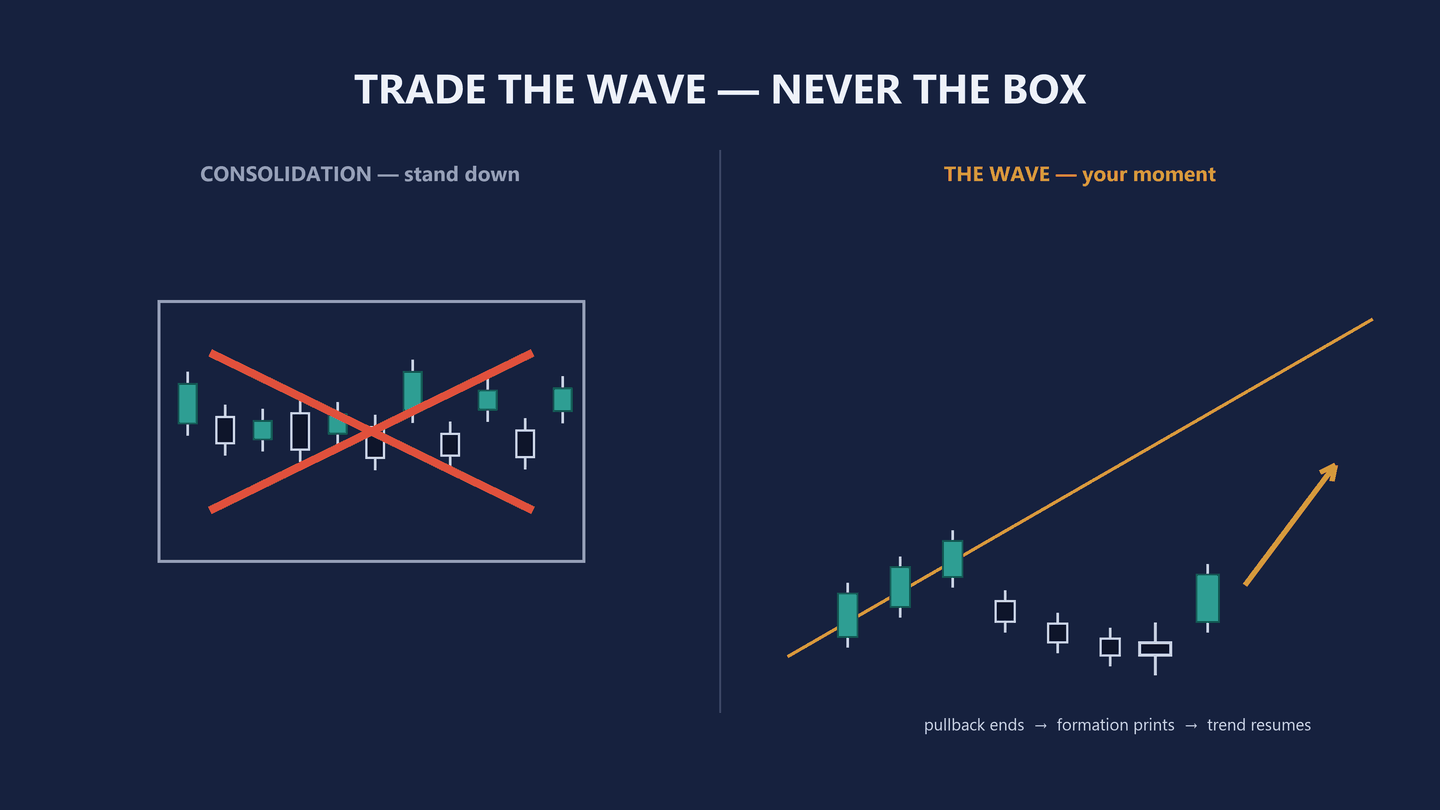
Diagram only · no instrument, no price, no outcome claimed
04 / Entry
Step three: closed candles, next open
Two conditions, and there is no flexibility in either.
First, the formation must be closed. Every candle in it. A Morning Star with the third candle still printing is not a Morning Star; it is a hope with a name attached. Half of what looks like a formation while it is forming turns into something else in the last minutes of the period.
Second, the u-turn. This is the one threshold this lesson adds, and it is worth saying plainly because the same number appears in the previous lesson doing a different job there: sixty percent decides whether a Tweezer counts, and sixty percent decides whether a reversal has turned. Same number, two rules. The final decision candle has to close beyond sixty percent of the first candle’s body. Fifty-five is not sixty. This is a threshold, and a threshold you move once is not a threshold any more.
Both conditions met, you enter at market, at the open of the very next candle. Not three candles later when it looks confirmed — by then the part of the move the formation was pointing at has already happened. Not before the close, because that is committing to an unfinished sentence.
Candles closed, u-turn cleared, next open. That is the entire entry rule.
Diagram · the entry, one candle late on purpose
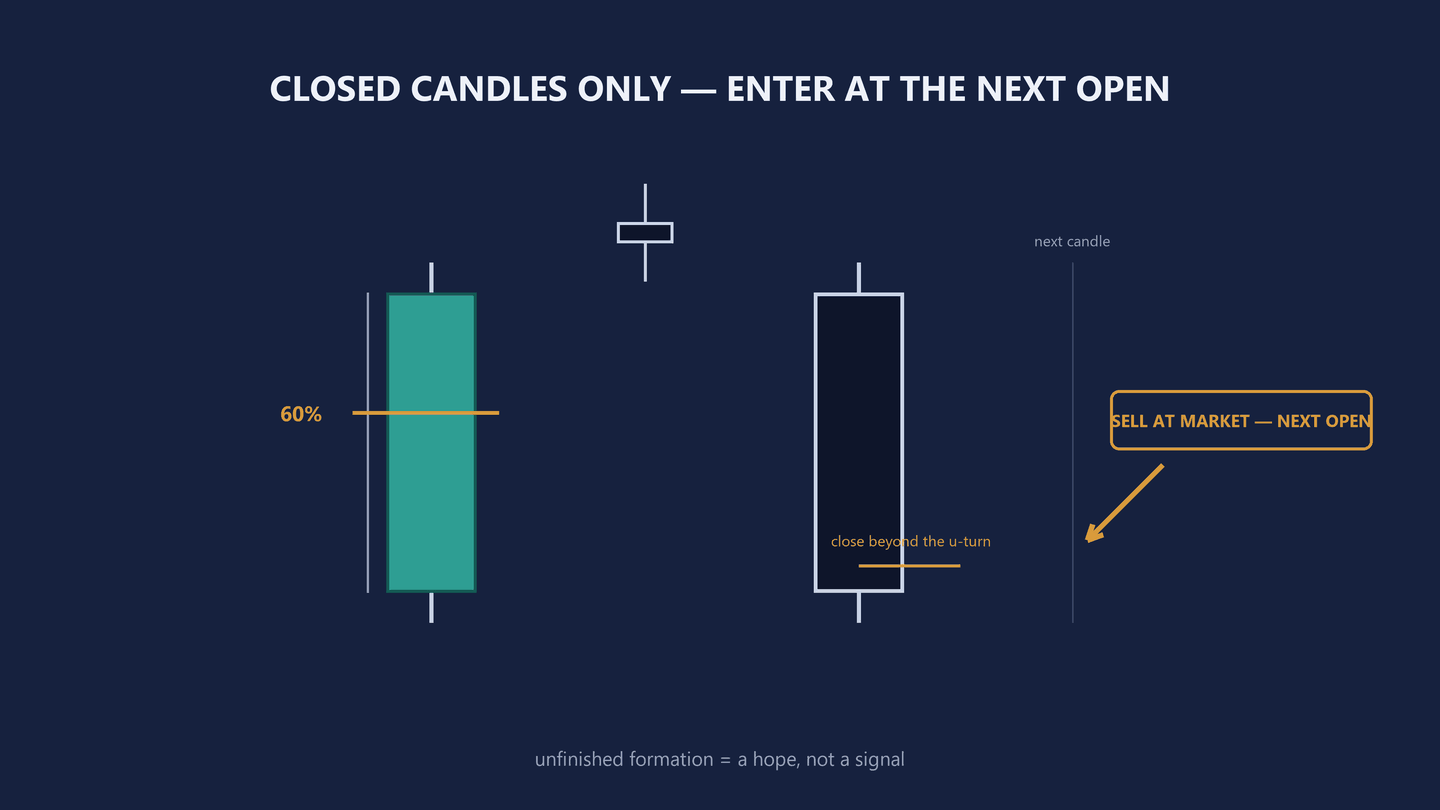
Diagram only · no instrument, no price, no outcome claimed
05 / Stop
Step four: the two numbers, and what they actually mean
Selling a bearish formation, the stop goes fifteen above the formation’s high. Buying a bullish one, ten below the formation’s low.
The asymmetry is deliberate. Sell-side stops sit above, where the spread on a bid-quoted chart works against you, so the ceiling is given more room than the floor.
Diagram · above and below, and not the same distance
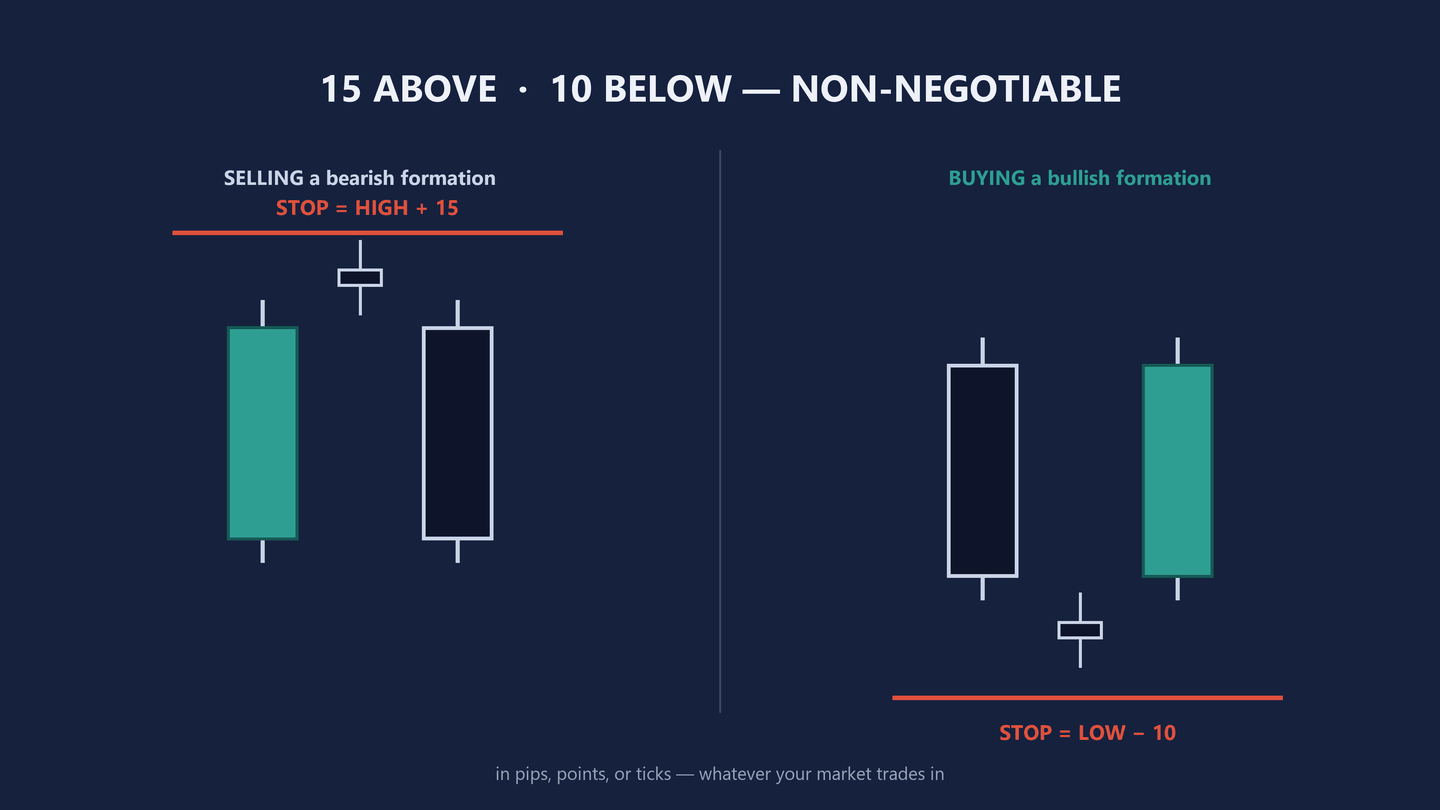
Diagram only · no instrument, no price, no outcome claimed
Before you write those two numbers down
Fifteen and ten came off a spot foreign exchange chart, measured in that market’s own minimum increment. They do not travel. Fifteen of anything on a Nasdaq-100 future is not the same distance as fifteen on a currency pair, and a number carried across instruments without conversion stops being a rule and becomes a superstition.
So take the shape of the rule and leave the digits behind. A fixed buffer beyond the formation’s extreme. Wider above than below. Sized against the instrument you are actually trading and its own recent range, rather than borrowed from somebody else’s chart. Measuring against the instrument’s own range instead of copying a distance out of a currency-pair textbook is the reason this course was written at all.
What is not negotiable is the part that survives the conversion: the stop is never at the extreme. There is always a buffer, and the next few paragraphs are why.
The market comes back and touches it
Why a buffer at all, instead of putting the stop one increment past the high? Because of what tends to happen immediately after you are in.
The market frequently comes back and touches the high or the low of the formation you just traded. It is a probe. After a bullish formation, sellers return to the low looking for leftover selling interest; if there is none there, the formation holds. After a bearish formation, buyers go up and probe the high for buyers; if nobody shows up, price rolls over.
So when price crawls back toward your formation right after entry, that is not automatically the pattern failing. Very often it is the pattern being checked.
The script puts a figure on how often — more than half the time, it says. Out it comes, for the same reason the eight-out-of-ten came out two sections ago. I cannot show you the sample, so I will not quote you the number.
What is left is more useful anyway, and you can verify it yourself. The return happens often enough that a stop placed one increment past the extreme gets taken out by the probe rather than by the trade being wrong. That is the entire job of the buffer: give the probe room to happen. Scroll back through a month of your own chart, mark every one of the six formations you can find, and count how many of them were touched again before the market went anywhere. That count is yours, on your instrument, and it is worth more than a percentage you inherited from a currency pair you have never traded.
06 / Target
Step five: past structure, then arithmetic
Before you can set a target you need the method’s definition of a past high, and it is precise rather than eyeballed.
A high is a candle whose wick reaches higher than the wicks of the two candles to its left and the two candles to its right. That is the whole test. Colours are irrelevant — a high can be a teal candle or a navy one. The four surrounding candles do not have to be consecutive either; gaps and overlaps do not break the definition.
Mirror everything for a low: two higher on each side.
Scan left across your chart and mark them. Those wicks are the market’s memory. Every past high is a place sellers turned up before. Every past low is a place buyers defended before. That is all a target is in this method — a place where the other side has already shown itself once.
Diagram · what counts as a past high
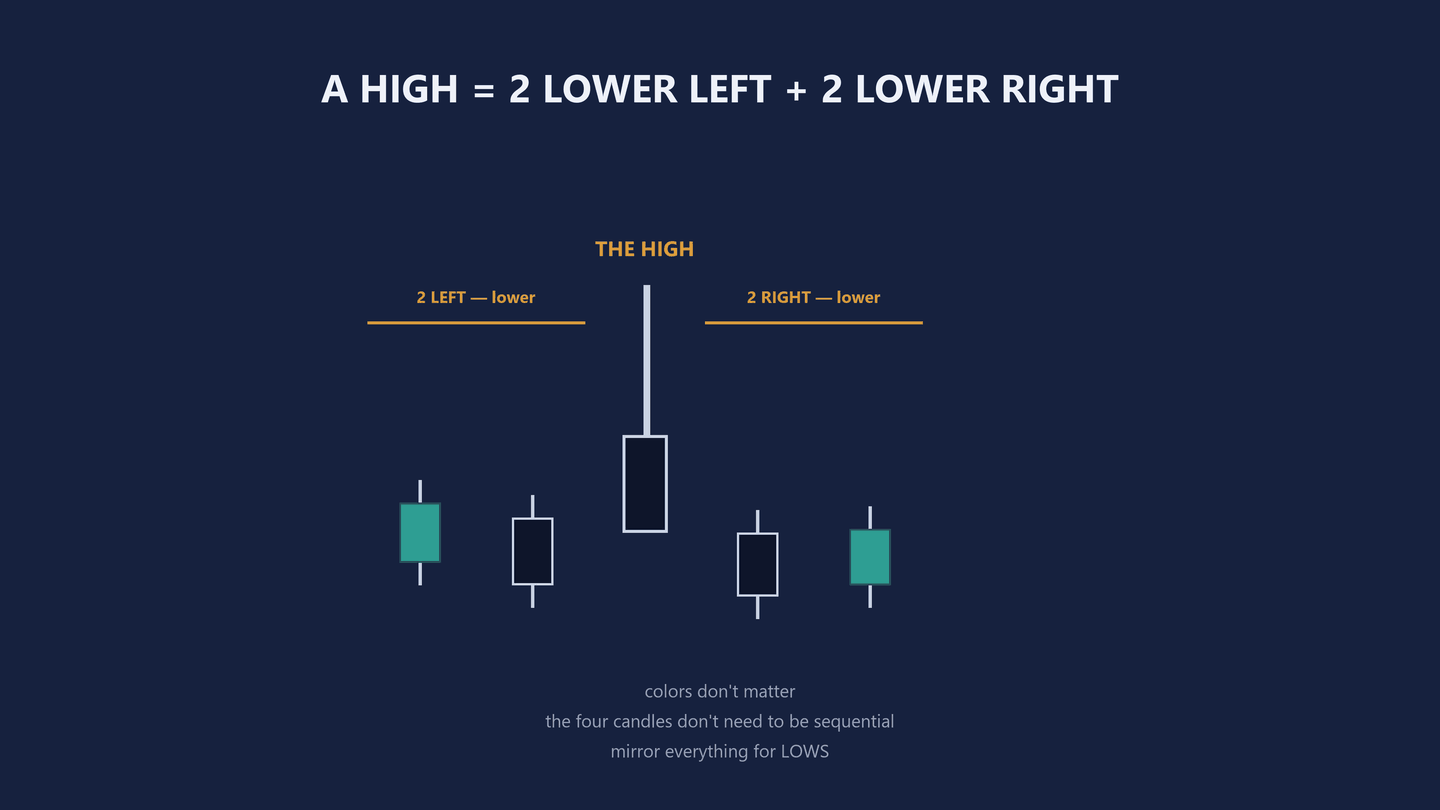
Diagram only · no instrument, no price, no outcome claimed
Four extremes, and the order sits in front
Now the exit itself. Selling, you find the four most recent past lows. Buying, the four most recent past highs. Number them, nearest first.
The target is a limit order placed in front of the past extreme, not on it — above a past low if you are selling, below a past high if you are buying, by a buffer sized the same way the stop was, in the instrument’s own unit.
In front, because the whole market can see that level and a wall of resting orders sits exactly on it. An order placed on the level has to wait for price to fight through the wall. An order placed in front of it does not.
And four rather than one, because the target has to survive the next test. You take the nearest extreme that satisfies the ratio; if the nearest one fails it, you check the second, and so on down the list.
One to one and a half, or nothing
The ratio is the last box and it is the one that decides. Minimum one to one and a half: risk one to aim for at least one and a half. Measure it before you click — the distance from entry to your stop against the distance from entry to your target.
If the nearest valid target does not clear one and a half times the risk, check the next one on the list. If none of the four do, here is the rule the entire method hangs off.
If the stop is so far away that no target on the list makes the arithmetic work, pass on the trade. Walk away from it. Then go and find a setup that does meet the requirement, on another timeframe or another instrument. There is always another trade. There is not always another account.
Diagram · the ratio, and the word that goes with failing it
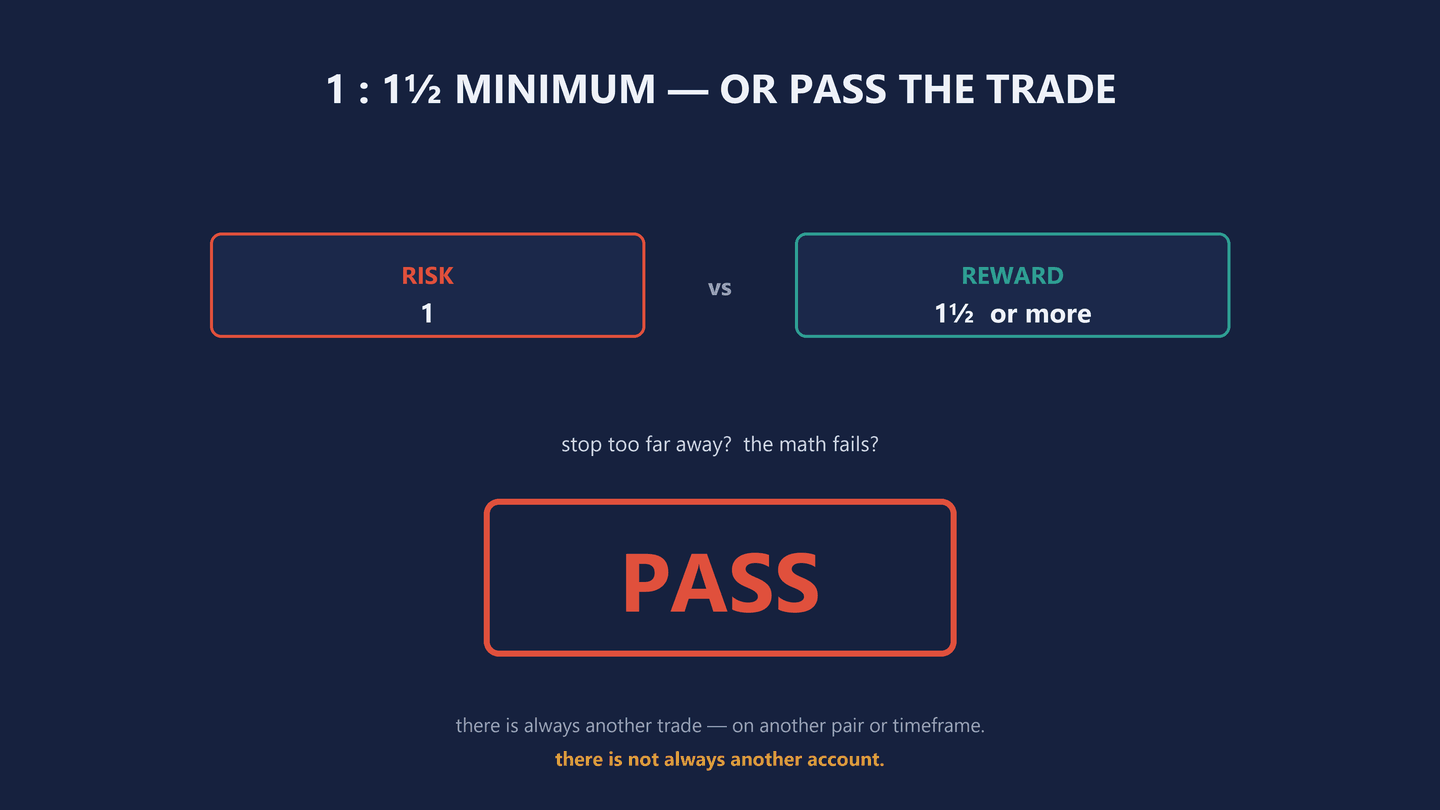
Diagram only · no instrument, no price, no outcome claimed
07 / Worked example
One trade, box by box
The whole protocol on one chart, start to finish.
One-hour chart. Price is below the trend line in a downtrend, and the four-hour agrees with it. Box one.
The market waves back up into the line and prints an Evening Star: a strong bull candle, a small doji above it, a strong bear candle closing past the sixty percent u-turn. It is one of the three shapes on today’s list, and it is standing at the end of a retrace. Box two.
Sell at market on the open of the next candle. Not before the bear candle closed, not two candles after. Box three.
Stop above the star’s high, by the buffer, in this instrument’s unit. Box four.
The nearest past low on the list clears one and a half to one. Limit order in front of it. Box five.
Then the market does what it very often does. It rallies back, kisses the high of the formation a short distance under the stop, and rolls over. The probe went looking for buyers and found none. Price falls away and the limit fills in front of the old low.
Five boxes, no improvisation, and nothing decided while the trade was live. Notice where the pattern sat in all of that: box two of five.
Diagram · the same trade, drawn
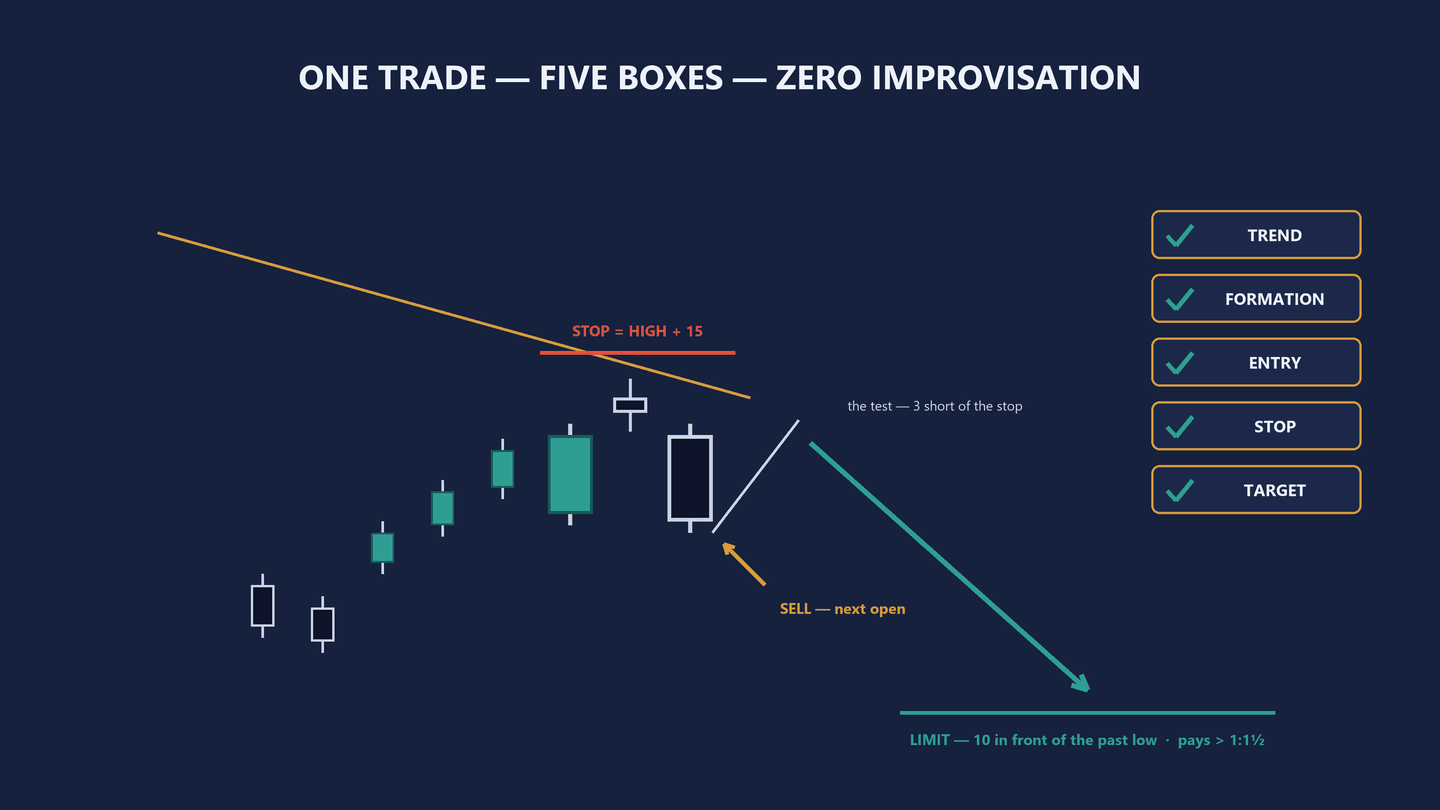
Diagram only · no instrument, no price, no outcome claimed
08 / Practice
Four questions, answered out loud
Cover the right-hand column and answer each one before you read it.
- Stop on a Morning Star
- Below the formation’s low, by the buffer — never at the low itself. The probe lives in that gap, and a stop without the gap gets taken out by it.
- Fifty-five, not sixty
- The final candle closed short of the u-turn threshold, so there is no trade. Sixty or nothing. The number is only a rule while it is the same number every time.
- Price returns immediately
- Patience. That is the probe, and the buffer was sized so it would have room to happen without reaching your stop. Nothing has failed yet.
- Stop too far for the ratio
- Pass. Say it out loud. Then open another chart — looking for the next setup costs nothing, and the one in front of you has already told you its answer.
Four for four means you have stopped having opinions about trades and started having a procedure. That is the whole difference this lesson was for.
09 / Recap
The protocol on one page, and the end of the course
- One
- Draw every trend line — inner, outer, long-term — and take the side of them the market is already on. Let the larger timeframe pick the direction before you look at a single candle.
- Two
- One of the six formations, standing at the end of a pullback inside a trend. Never inside a sideways box.
- Three
- Every candle in the formation closed, the u-turn past sixty percent, entry at market on the next open.
- Four
- The stop a fixed buffer beyond the formation’s extreme, wider above than below, sized to the instrument. Never at the extreme itself, because the market comes back and touches it.
- Five
- Four past extremes, limit order in front of the nearest one that pays. One to one and a half, minimum — or pass.
That is the machine. Four lessons: what a single candle records, the shapes that mean the market could not decide, the six formations worth carrying, and the protocol that turns one of them into a decision you can write down before you take it.
What to do with it now. Take the protocol to a chart you already watch and run it backwards over the last month. Not to count winners — to count how many days had no setup at all that ticked all five boxes. That number is the lesson. Most of the work in this method is the work of not trading, and seeing it on your own chart is the only thing that makes it believable.
Then run it forward on paper until you stop having to look the steps up. The order is the part that matters more than the speed: trend, formation, entry, stop, target. Miss one and the other four do not matter.
Two lessons follow this one, and they are the two that make the protocol usable rather than merely correct. Lesson five is ten plates with the labels taken off: you name the formation before you open the answer, and find out whether you can actually see them. Lesson six answers the question every page so far has stepped around — whether the price a formation printed at is one anybody defends.
There is a printable companion to the course: five pages covering the candles that mean doubt, the six formations, this protocol, and the swing definition the rest of it hangs off. It is free, and it arrives by email, because that is the only way I can send you a file.
This lesson also exists as a video, published , if you would rather be talked through it: The Complete Trading Protocol (Entry, Stop, Target). It quotes two figures that this page does not, and the reasons are written into sections 03 and 05 above. The written version is the one that gets corrected, and those are two of the corrections.
Next lesson: find the formation → The course, all six lessons →