The candlestick course · lesson one of six · Zonetta Trading
How to read a single candlestick
A candle is the record of one fight over one window of time. It answers four questions, and there are only two kinds of answer it can give.
Written lesson · about thirteen minutes · free, and it asks for nothing
01 / Origin
Where the notation came from
Osaka, in the middle of the eighteenth century. Before Wall Street existed, before the New York Stock Exchange was an agreement signed under a buttonwood tree. Inside a wooden hall, rice merchants shouted prices at each other, and somebody in that trade started drawing the price of rice as a shape rather than as a line: a small rectangle with a thin wick, like a candle.
Who drew the first one is not something anybody can now establish. The stories that circulate about it are stories, and I am not going to repeat them as history on a page about your money. What is not in doubt is the notation itself — that it came out of the Japanese rice trade, and that it has outlived every market that has used it since. It is on your phone right now.
Nearly three centuries later the shape has not changed. Same body, same wick, same story. The only difference is that it is no longer rice.
02 / The unit
One candle is one window of time
Rule one, and it comes straight from the rice trade: a candlestick measures what price did inside a fixed period. One candle, one window of time.
On a one-hour chart, every candle is one hour of argument between buyers and sellers compressed into a single shape. When the hour ends the candle closes, its story is sealed, and a new one starts. Change the chart to fifteen minutes and every candle is fifteen minutes of the same argument. Nothing else about the reading changes.
Diagram · one candle, one period
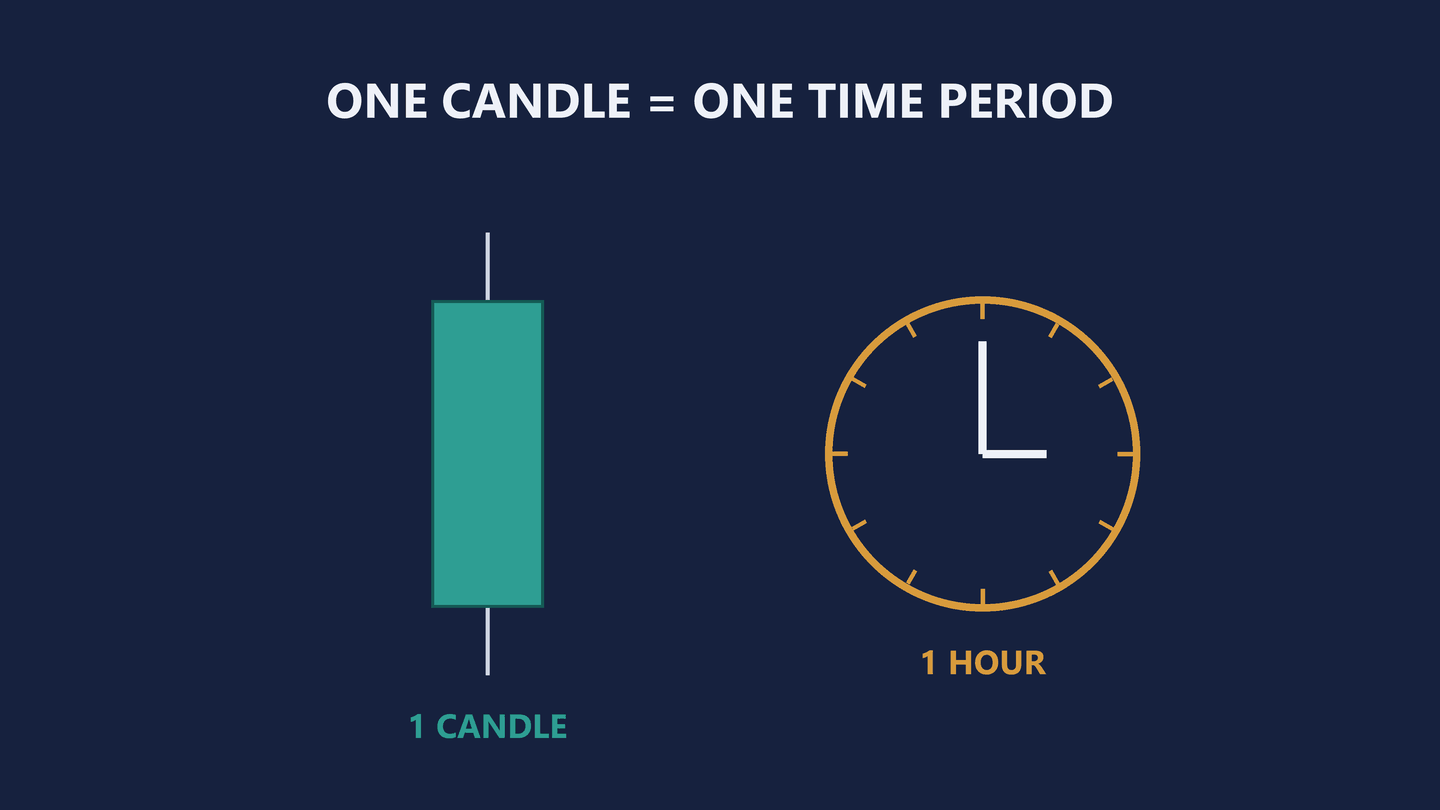
Diagram only · no instrument, no price, no outcome claimed
03 / Anatomy
The four questions every candle answers
Where did price open. Where did it close. How high did it go. How low did it go. Open, close, high, low. That is the entire code, and everything else in this course is built on top of it.
In a bullish candle, price opens at the bottom of the body and closes at the top. Buyers won that window and price travelled up. The thin lines above and below the body are the wicks: the high is the top of the upper wick, the low is the bottom of the lower wick — the extremes price touched and could not hold on to.
Diagram · anatomy of a bullish candle
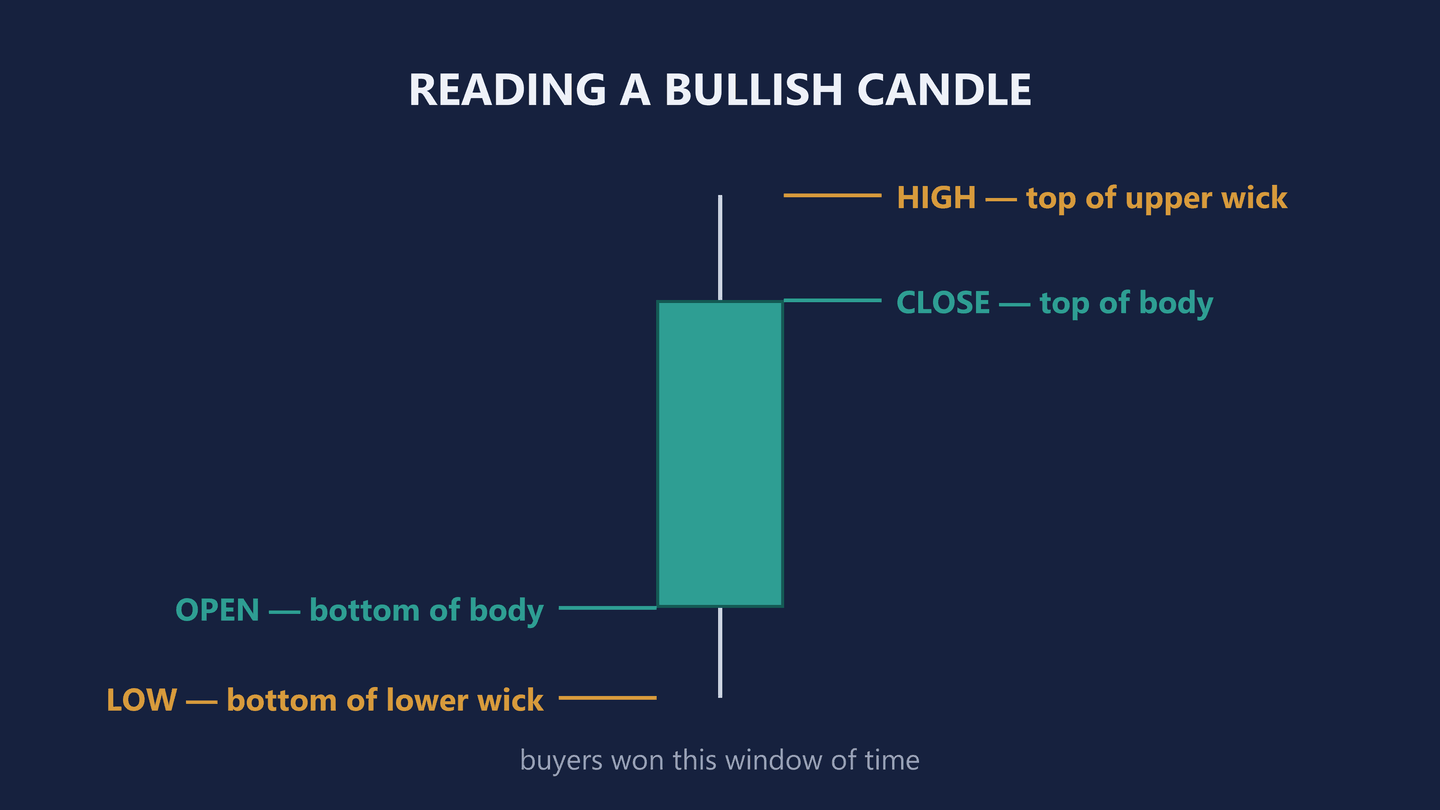
Diagram only · no instrument, no price, no outcome claimed
Now the mirror image. In a bearish candle, price opens at the top of the body and closes at the bottom. Sellers won. The same four answers, the other way up.
That is all a candle is. Not magic and not a prediction. A record of one fight: who won it, by how much, and where each side got pushed back.
Diagram · bullish and bearish, mirrored
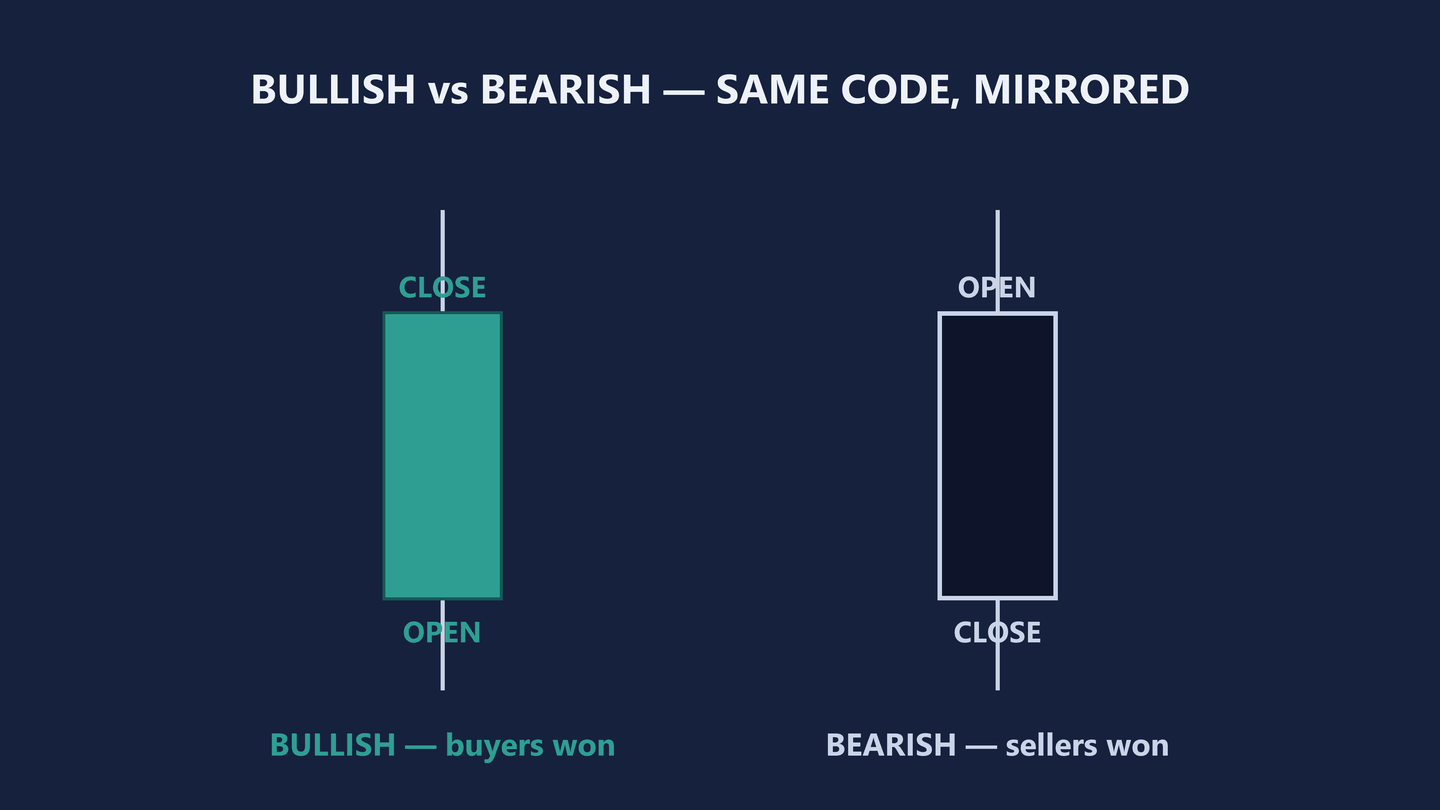
Diagram only · no instrument, no price, no outcome claimed
04 / Vocabulary
Why bullish, why bearish
The two words come from the way each animal attacks. A bear attacks from above: it rears up, brings its paws down and puts you on the ground. Bearish means price going down. A bull attacks with its horns: it catches you low and throws you upward. Bullish means price going up.
It is a silly image. It is also the reason people stop mixing the two words up.
One piece of housekeeping before the diagrams get busier. Everywhere on this page and in the rest of the course, teal is bullish and dark navy is bearish. Teal means buyers won that window. Navy means sellers did. There is no red and no green in the diagrams of this course, in this lesson or in the three that follow. The screenshots elsewhere on this site are photographs of a live platform and carry whatever colours that platform was set to; these diagrams are drawn, and they are drawn in two colours on purpose.
Diagram · the colour convention
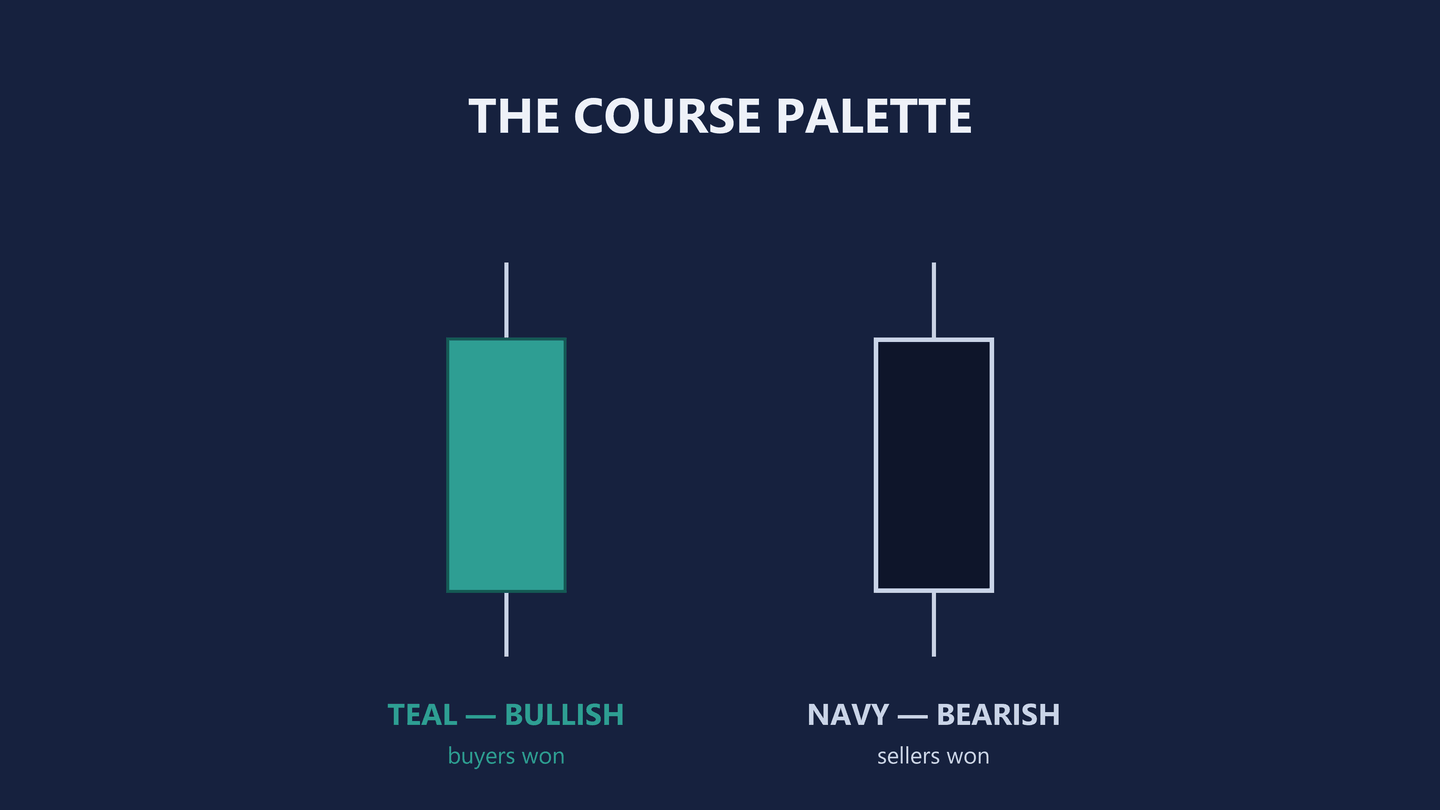
Diagram only · no instrument, no price, no outcome claimed
05 / The families
There are only two kinds of candle
Here is the sentence the rest of the course is built on. There are only two types of Japanese candlestick. Two. Not fifty patterns to memorise, not a hundred names to learn. Every candle that has ever printed on any chart — the rice market then, a Nasdaq-100 future this morning — belongs to one of two families: decision candles, and indecision candles. The market either knows what it wants, or it does not.
Decision candles
A big filled body, bullish or bearish, with little or no wick. Read what the shape is telling you: price opened, moved hard in one direction, and closed there. No hesitation, no pullback worth printing. One side took control of the whole window and kept it to the end of it.
Diagram · family one, decision
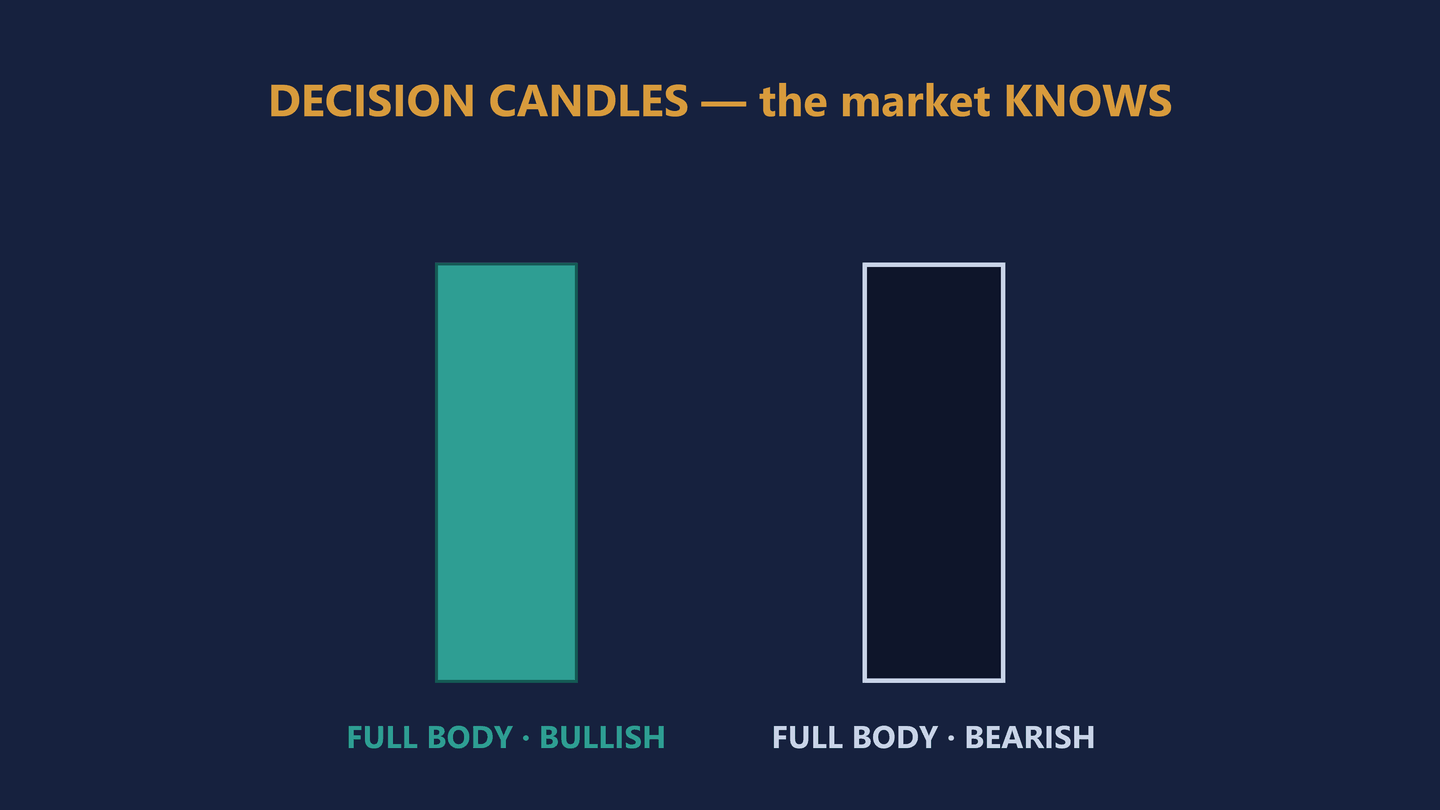
Diagram only · no instrument, no price, no outcome claimed
Indecision candles
Small bodies, long wicks. The shapes with the strange names — the spinning top, the doji star, the dragonfly doji, the gravestone doji, the hammer. Look at the silhouette: price travelled up, travelled down, and closed almost where it opened. Both sides fought the full window and neither of them won it.
That is the market hesitating, and it is where the whole course is going. The turns that candles warn you about form inside exactly those moments. The next lesson is about this family alone, one shape at a time.
Diagram · the whole taxonomy on one plate
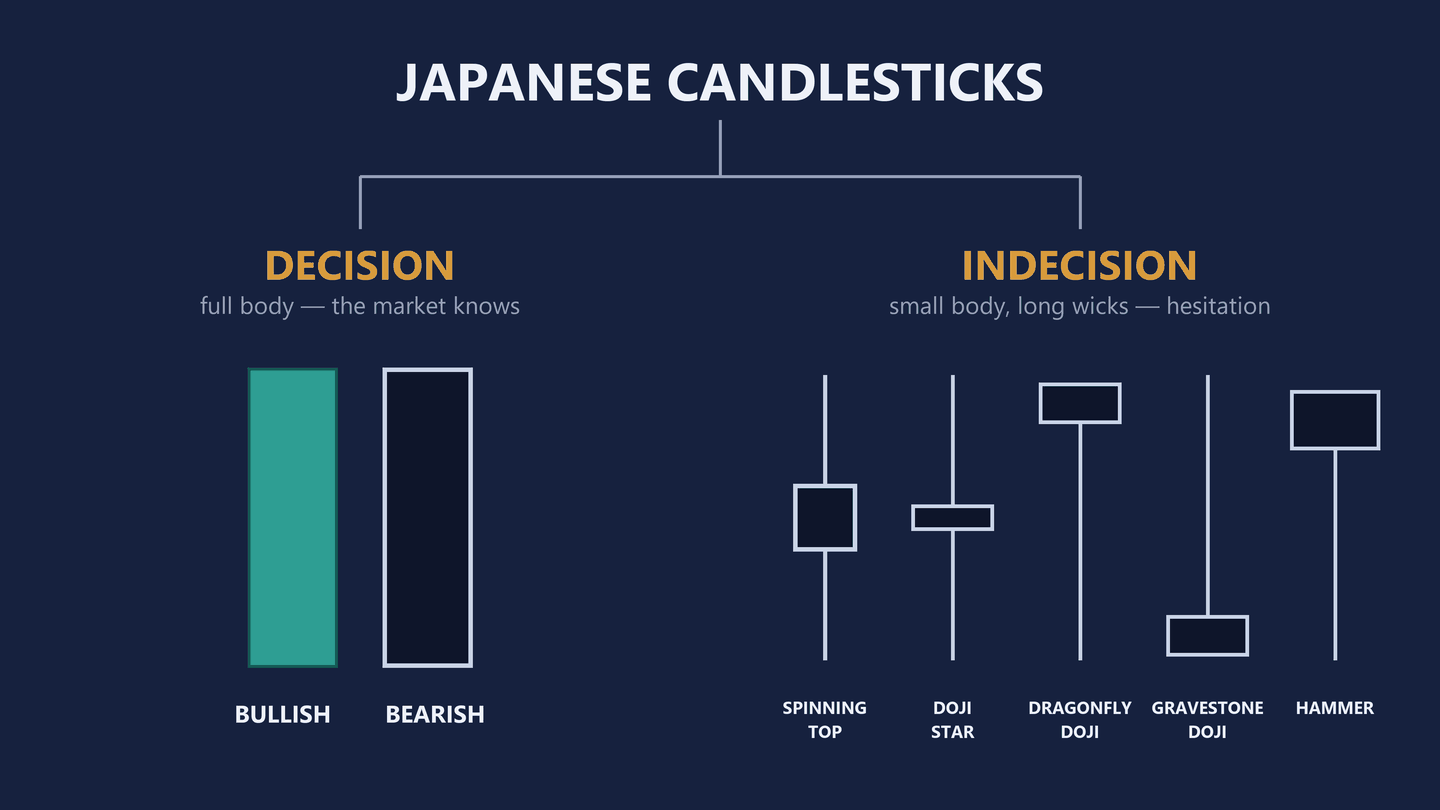
Diagram only · no instrument, no price, no outcome claimed
A candle does not tell you what happens next. It tells you what just happened and which side had to give ground doing it. Everything else in this course is about deciding when that is worth acting on.
06 / Practice
Three candles, read out loud
Cover the right-hand column and name the family before you read the answer.
- A big teal body with no wicks
- Decision, bullish. Price opened at the low of the period and closed at the high of it. Buyers owned the window from one end to the other.
- A tiny body with long wicks on both sides
- Indecision. Price went up, came back, went down, came back, and finished near where it started. A full fight with no winner.
- A full navy body closing at its low
- Decision, bearish. Sellers took it at the open and held it to the close, and nothing they gave back was large enough to print a wick.
The same two questions work on any candle on any chart. What are the four prices, and does the body dominate the wicks or the other way round. Two families, four price points, and that is the skill this lesson was for.
Do it on your own chart rather than on mine. Open any instrument on any period, and read the last twenty candles left to right, out loud, one word each: decision, decision, indecision, decision. It takes a few minutes and it is the only part of this lesson that actually installs.
07 / Timeframes
The same code on every clock
One 4-hour
16 × 15-minute
Candlestick formations appear on every timeframe: fifteen-minute, thirty-minute, hourly, four-hour, daily, weekly, monthly. The code does not change. What changes is the size of what you are reading, and that matters before anything else does.
The larger the timeframe, the larger the formation, and the larger the distance you have to risk to trade it — measured in points or in ticks, depending on the instrument. The smaller the timeframe, the smaller the formation and the smaller the protective stop. A weekly candle is a giant. A fifteen-minute candle is a soldier. Identical shape, very different consequence for an account.
Diagram · same shape, four clocks
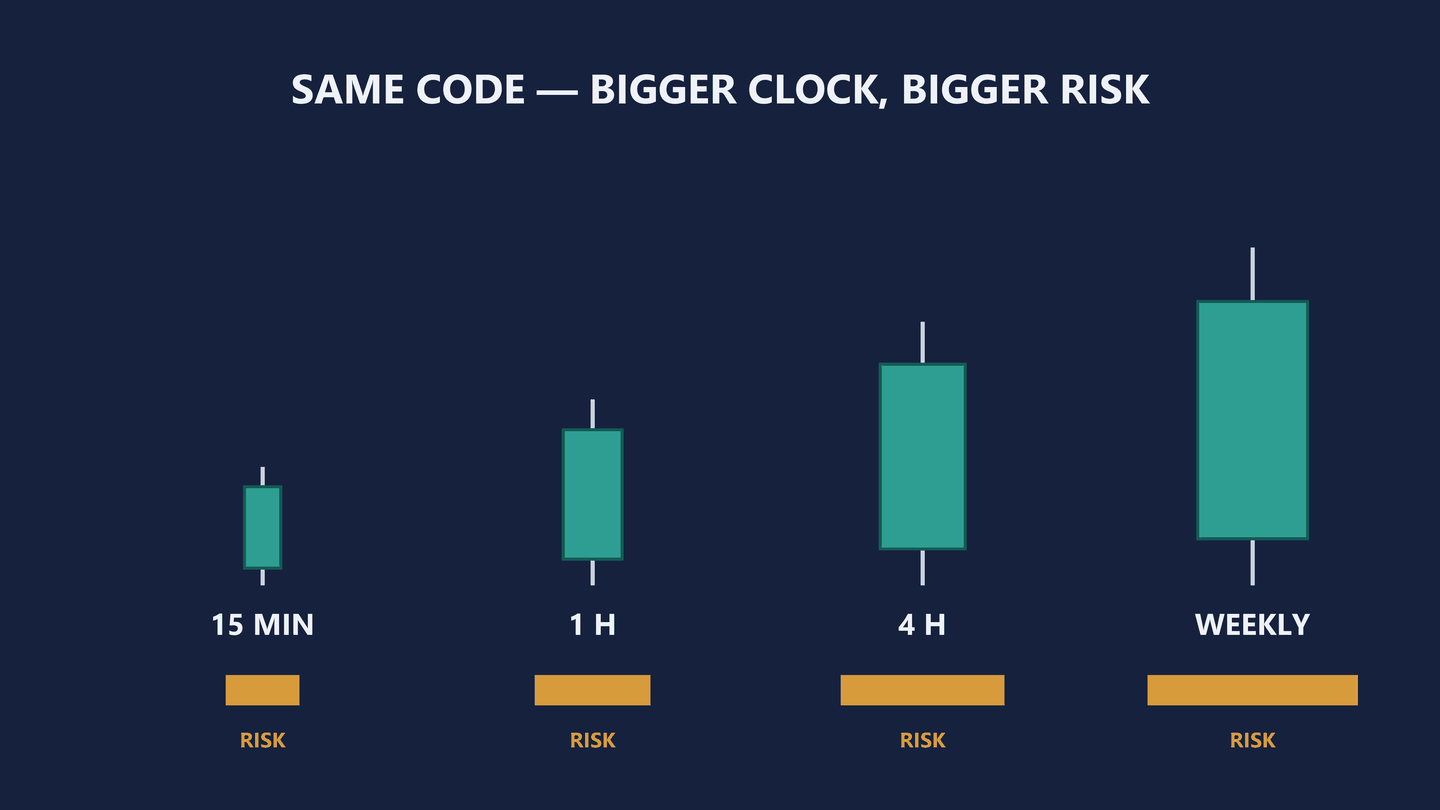
Diagram only · no instrument, no price, no outcome claimed
Then the detail that makes timeframes click. Take one four-hour candle and look inside it. It contains 16 fifteen-minute candles — a whole afternoon of separate fights compressed into one shape. A wick that reads as a small rejection on the four-hour was, inside, a full attack and a full retreat.
Every candle is a compressed film. The timeframe only decides how much footage you are watching per frame. Keep that image, because later in the course you hunt formations on one clock and confirm them on a bigger one.
Diagram · inside one four-hour candle
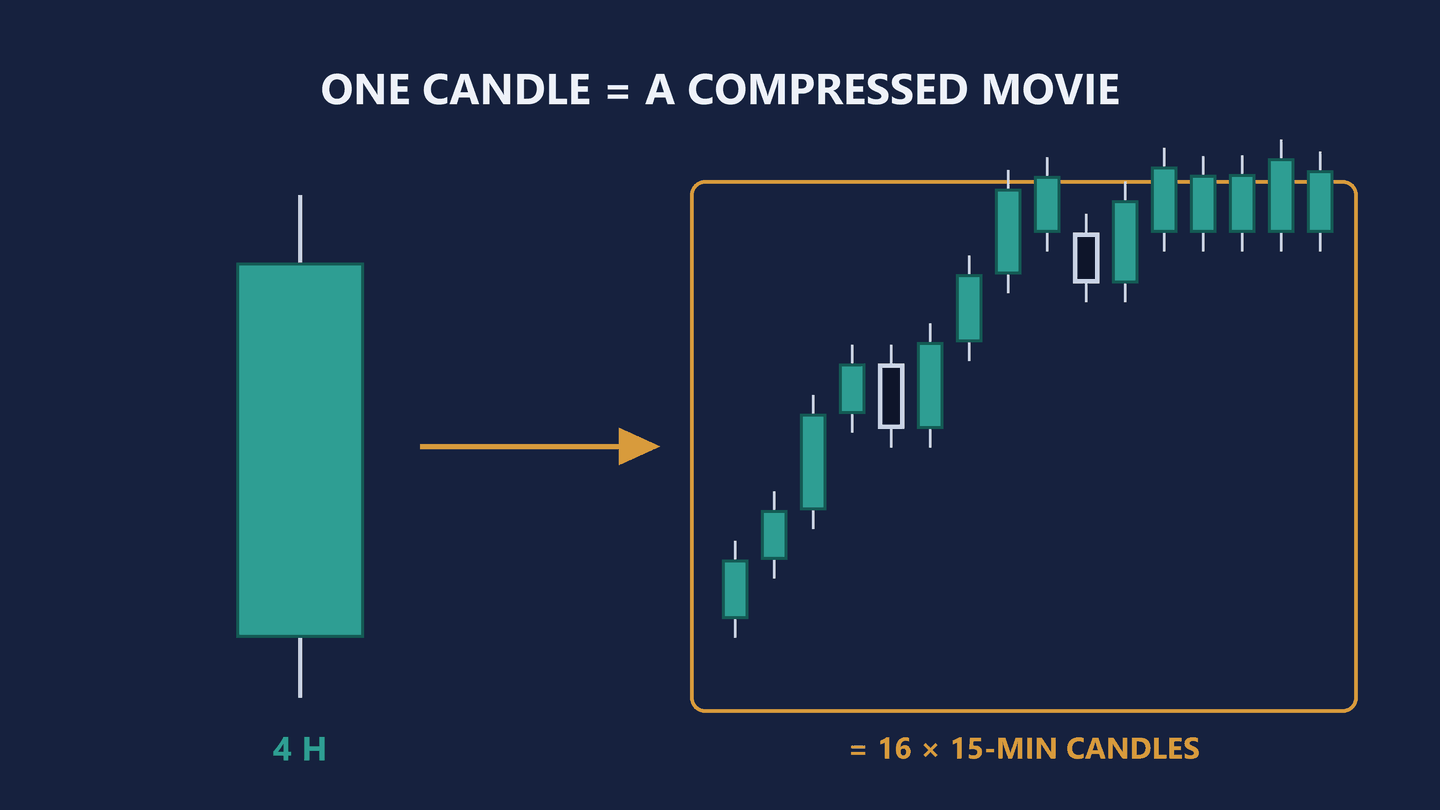
Diagram only · no instrument, no price, no outcome claimed
Whatever you end up risking, the reward has to justify it, and that comparison is made before the trade rather than during it. The fourth lesson turns it into a written protocol: where the entry sits, where the stop sits, where the target sits, and when the honest answer is to leave the trade alone.
08 / Recap
What to take away, and what comes next
- One
- Candles are the market’s sign language. Each closed candle tells you what just happened and which side had to give ground.
- Two
- One candle is one window of time, and it answers four questions: open, close, high, low.
- Three
- Bears attack downward, bulls attack upward. That is the whole of why the two words mean what they mean.
- Four
- Only two families exist. Decision, full body, the market knows. Indecision, small body and long wicks, the market is hesitating.
- Five
- The same code runs on every timeframe. Bigger clock, bigger formation, bigger risk in points or ticks.
If you can name the family of a candle without stopping to think about it, you are ready for the next lesson. That one is the indecision family in full: the shapes that mean neither side was in control, why each of them is a warning rather than a direction, and how people get trapped reading them as a signal.
Six lessons are written, and this is the first. After the candles of doubt come the six formations worth keeping, and then the protocol for entry, stop and target. Both of the lessons this page used to describe as planned now exist: ten drills to prove you can see the shapes without being told where they are, and the last one, on the thing a candle cannot tell you — whether the price it printed at is one anybody defends.
There is a printable companion to the course: five pages covering the candles that mean doubt, the six formations, the protocol, and the swing definition the rest of it hangs off. It is free, and it arrives by email, because that is the only way I can send you a file.
This lesson also exists as a video, published , if you would rather be talked through it: The 300-Year-Old Code Hidden in Every Chart. The written version is the one that gets corrected.
Next lesson: the candles that mean doubt → All six lessons →