Zonetta Trading · Tools · product note written
Zone Score MTF — every zone graded before price gets there
It draws supply and demand zones from two timeframes on one chart and puts a grade out of seven on every zone it draws, the moment it draws it — so the decision about which zone deserves your risk is already made by the time price arrives.
Status: Waitlist open
It will be a subscription. The price is not decided, and I am not going to pretend it is. Joining the list costs nothing and commits you to nothing. This tool is a separate product from the course — neither one includes the other.
01 / On the chart
What it puts on your chart
Two timeframes at once. The higher one carries the context and the lower one carries the entry, and both draw onto the same chart rather than making you flip between two windows and hold the picture in your head.
Every zone it draws is graded as it is drawn. The grade sits on the zone, in the zone’s own label, before price has come anywhere near it. That is the entire point of the tool: grading a zone while price is already inside it is not grading, it is looking for permission. How the grade behaves once price does arrive — two zones this tool graded in August, with their outcomes — is on the Zone Score page.
Zones price has already run through are dimmed or dropped instead of being left on the chart to flatter the picture. A chart that keeps every zone it ever drew will always look like it was right.
It reads the instrument’s own minimum price increment, so a futures contract and a spot foreign exchange pair are both handled without being re-taught. One engine, any chart TradingView can draw — index futures, metals, single stocks, exchange-traded funds, currencies.
- Where it runs
- TradingView. It will be an invite-only script: access is granted to a named TradingView account. There is nothing to download and nothing to install.
- How many timeframes
- Two at a time — one for context, one for the entry. A higher pair suits swing and intraday work; a lower pair suits a single session. The captures below are the lower, session-length pair.
- How many instruments
- No fixed list. It grades what is on the chart, so the same script behaves on gold, on an exchange-traded fund and on a copper contract without a per-instrument setup.
- What it prints
- The zone, its two edges, and one grade out of seven in the zone’s label. Nothing else.
- What it sends
- Nothing. It draws and it grades. It never places, modifies or cancels an order, and it never touches an account.
The three captures below are real screens from my own charts, not mock-ups. They come from the session-length edition of this engine, which is why the label at the top left of the gold and QQQ captures reads Zonetta Trading M5 + M15 Indicator — same method, same grading, the pair of timeframes tuned for one session. Everything else on those screens — the price scale, the crosshair, the time markers, the overnight tag — is TradingView’s own chart furniture. The only marks that belong to this tool are the zone bands and their labels.
Screen capture · Gold spot, 5-minute chart with 15-minute context ·
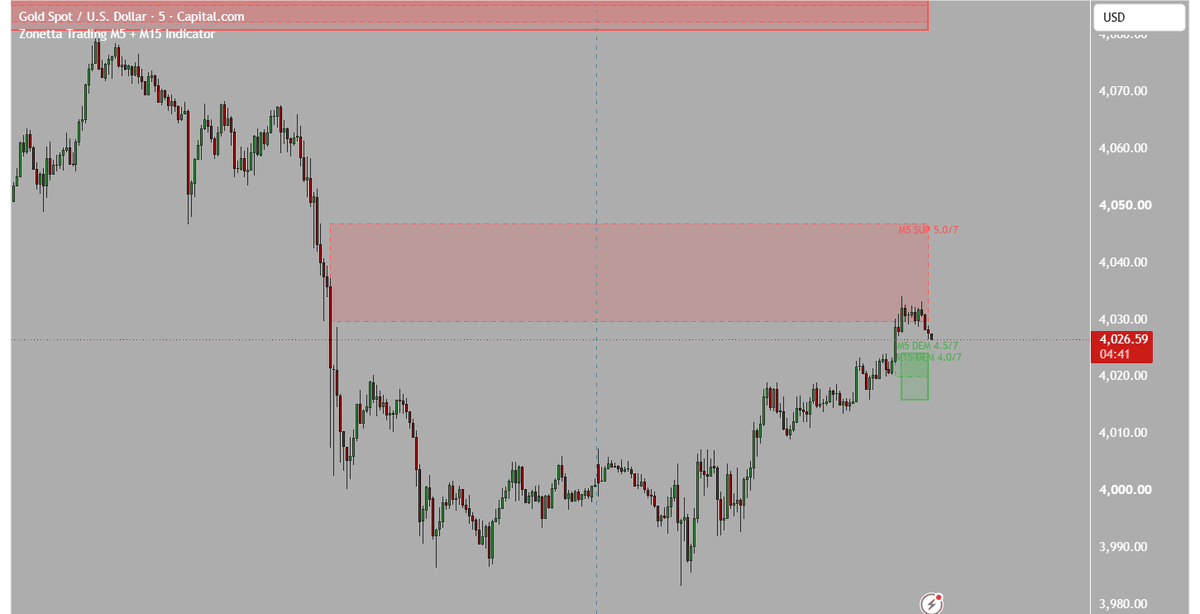
Screen capture of my own chart · the prices are real · no outcome is shown and none is claimed
Screen capture · Invesco QQQ Trust, 5-minute chart with 15-minute context ·
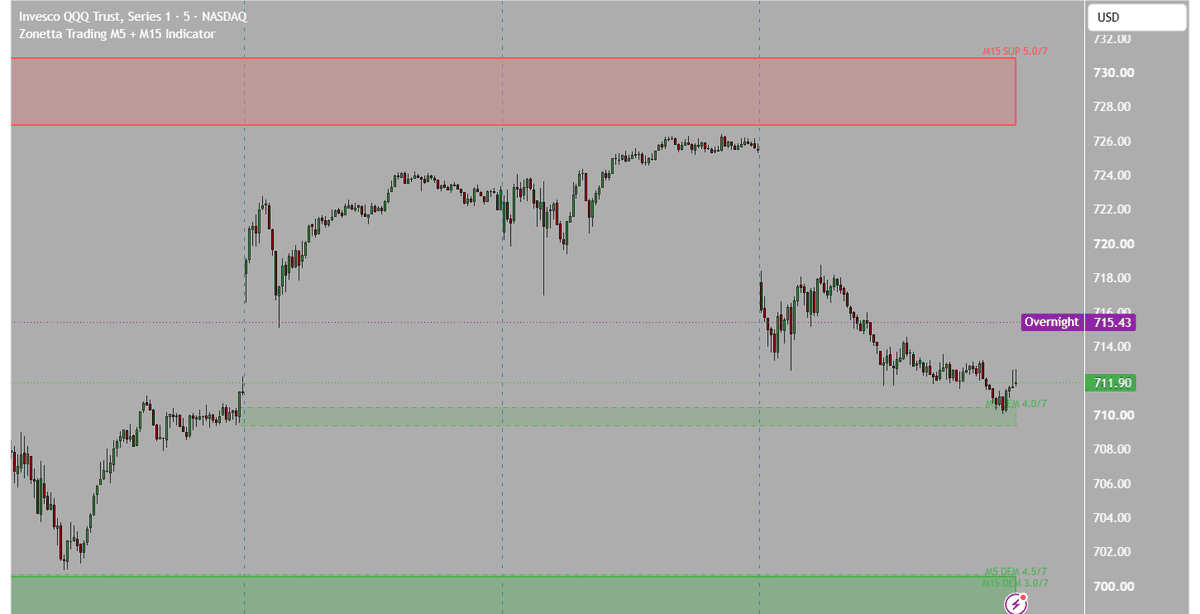
Screen capture of my own chart · the prices are real · no outcome is shown and none is claimed
Screen capture · Copper futures, 15-minute chart ·
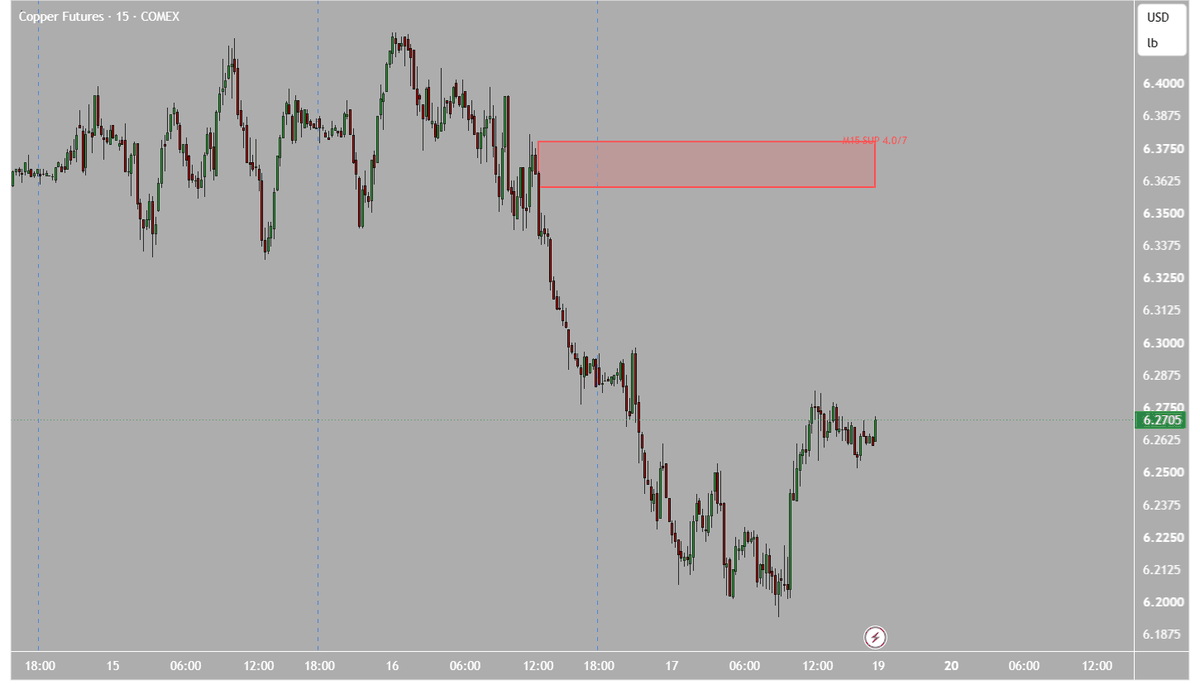
Screen capture of my own chart · the prices are real · no outcome is shown and none is claimed
02 / The number
What the grade out of seven actually means
Public: the cut
Private: the settings
Four criteria, and they have names: Strength, Time, Freshness, and Trend and Location. Each one asks a question about the zone. Their answers sum to a single number between zero and seven, and that number is what gets printed on the chart.
The cut-off is three and a half. A zone that reaches three and a half is one I am willing to work with; a zone below it does not get my risk, however good the chart looks around it. That number is public, it is on the free checklist, and it is the whole discipline in one line.
The four questions
- Strength
- How hard did price leave this zone — not in isolation, but measured against the size of the zone itself? A small base that produced a large move is stronger evidence than a wide one that limped away from it.
- Time
- How long did price spend building the base before it left? This one has a ceiling: past a certain length a base has stopped being a base and become a range, and a range is a different animal with different odds.
- Freshness
- Has price been back since the zone was made — and how far back is the tool still willing to look before a zone is simply old news that nobody is defending any more?
- Trend and Location
- Does the zone sit on the right side of the larger move, and has it been given anywhere to go? A perfect zone with the trend running against it, or with the next obstacle sitting immediately in front of it, is not a good trade.
Every one of those questions has one exact answer written into the script. Those answers are the product, and they are not published: not on this page, not in a video, not in anything you can download, and not by request. The criteria are the method, and the method is taught in the open. The settings behind them are the thing you would be subscribing to.
5 / 7
Example output
The free Zone Score checklist → How the zones are drawn in the first place →
03 / Limits
What it does not do
This list is longer than the feature list on purpose. Most of what gets sold to traders is sold on the things it is careful not to say.
- It does not give you a signal. There is no buy arrow and no sell arrow on any capture above, and there will not be one in the released script.
- It does not send an order, size a position, set a stop or touch your account in any way.
- It does not come with a back-test, a win rate, a profit factor or an equity curve. No figure of that kind appears anywhere on this site, and none will be attached to this tool.
- It does not predict a turn. A zone that grades well can fail, and some of them do — the grade is a measure of evidence, not of what happens next.
- It does not include anything else you may have seen on my charts. The daily gamma levels, the hedging-pressure layer and the candlestick work are separate programs. Nothing on this page is a claim about them.
- It does not decide for you. It grades the zone and then it stops; what to do about a graded zone is a decision this tool has no opinion about.
- It does not replace learning to grade a zone yourself. That is section five, and it is the section I most want you to read.
04 / The model
Why a subscription, and why there is no price on this page
A charting script is not a finished object you buy once and own forever. It sits on top of somebody else’s platform, reading somebody else’s symbols, on contracts that expire and roll and get re-listed. Left alone, it does not stay still — it rots quietly, and the first you hear about it is a zone drawn in the wrong place. A subscription pays for the part that never ends: keeping it correct.
There is also a plain platform reason. TradingView cannot bill anyone for an invite-only script — there is no payment mechanism on the platform for it, and access is granted by hand to a named account. That is a large part of why this website exists at all.
The price is not decided. When it is, it will be published here in full, in a currency, with the billing period stated, with what is included stated, and with how to cancel stated — before anybody is asked for a card. There will be no countdown, no launch-week timer and no vanishing founder tier on this page. If you ever see one, it is not mine.
No price appears on this page because there is no price yet. A waitlist that will not tell you the price is one thing; a waitlist that invents one to look finished is another, and I would rather look unfinished.
05 / Not a bundle
This is not part of the course, and the course is not part of this
Say it flatly, because at these prices an assumption becomes a refund request, and a refund request is what an unclear sentence costs.
The course does not include this indicator, and this indicator does not include the course. They are two products. Buying one gets you one.
They are also not substitutes for each other, and it matters which one you need. Zonetta Supply and Demand — Rate every zone 0 to 7. Trade only what clears 3.5. teaches you to draw a zone and grade it by hand, on paper, in about ten seconds, on any chart, with no software running. That skill does not expire, does not depend on a platform staying in business, and does not stop working the day a subscription lapses.
This tool does the same grading for you, faster, on more charts at once, without getting tired at eight in the morning. It is a speed and consistency instrument for somebody who already knows what the grade means. It is a poor way to learn what the grade means, because a number you did not work out yourself teaches you very little.
So if you are only ever going to get one of the two, get the one that puts the skill in your hands: the course. Then, if you want the same reading on twenty charts before the open instead of three, the list below is for you.
06 / The list
What joining the waitlist actually gets you
One email, when the script is genuinely released, telling you it is released and what it costs. That is the whole of it. No sequence, no launch webinar, no daily countdown, and no second list you did not ask to be on. If it turns out the tool should not be sold at all, you will get one email saying that instead.
Nothing is charged and nothing is reserved by joining. There is no queue position, no founder pricing being held for you, and no advantage bought by being early — the list is a notification, not a transaction.
While you wait, the useful things here are already free and already published: the morning levels, and the method the grade is built on.
Join the waitlist See today’s levels → Every tool on the shelf, with its honest status →